
Highlights
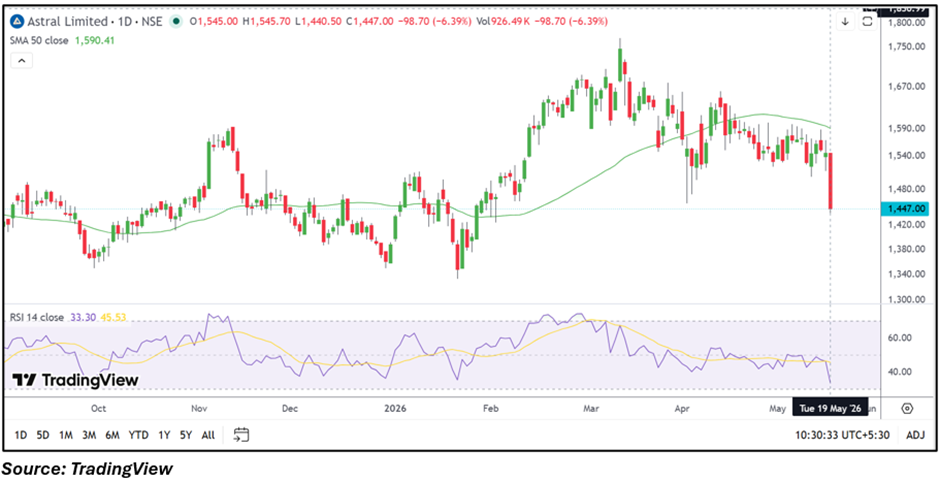
- Astral shares declined over 6% despite reporting profitable March quarter earnings.
- The stock slipped below its 50-day SMA, indicating weakening near-term momentum.
- RSI dropped close to oversold territory as selling pressure intensified during trade.
Overview
Astral Limited shares came under pressure on May 19, with the stock falling nearly 6.4% to around ₹1,447 during intraday trade. The decline followed the company’s March 2026 quarterly earnings announcement, even as the company remained profitable on a standalone basis.
Astral reported standalone total income of ₹1,92,060 lakh for the quarter ended March 2026. Profit before tax stood at ₹32,340 lakh, while net profit came in at ₹23,770 lakh with earnings per share of ₹8.85.
Fundamental View
Despite posting profit growth during the quarter, investors appeared cautious amid broader valuation concerns and slowing momentum in the stock. Counters trading at elevated earnings multiples often witness sharp corrections when market expectations remain high.
Market participants may also be assessing demand trends, margin sustainability, and future growth visibility across pipes, adhesives, and construction-linked segments. Profit-booking activity after recent rallies may have further added pressure to the counter.
Technical View
Astral stock is currently trading near ₹1,447 and has slipped below its 50-day SMA placed around ₹1,590.41, indicating a weak short-term technical setup. Recent price action reflects strong selling pressure after the stock failed to hold higher consolidation levels near ₹1,550. The 14-day RSI has dropped sharply near 33.30, suggesting fading momentum and weakening market sentiment. The sharp decline also indicates increased caution among short-term traders.
Momentum Indicator
The RSI near 33 suggests the stock is approaching oversold conditions in the near term. Momentum indicators currently remain tilted toward weakness unless recovery above key moving averages emerges.
Key Technical Levels
- Support: ₹1,320–₹1,235
- Resistance: ₹1,590–₹1,676
Risks to Watch
- Astral faces valuation pressure due to elevated earnings multiples.
- Weak technical momentum may trigger additional short-term selling activity.
- Margin fluctuations could impact future profitability expectations.
- Broader market volatility may affect construction-related sector sentiment.
Summary
Astral shares witnessed sharp selling pressure despite reporting profitable quarterly earnings, as traders reacted to weak technical indicators and valuation concerns. The stock has fallen below its 50-day SMA while RSI momentum has weakened significantly. Investors are now watching whether support near ₹1,320 can stabilize the decline, while resistance near ₹1,590 remains crucial for any recovery attempt.
FAQs
- Why did Astral shares fall despite reporting profit growth?
The stock declined due to valuation concerns, weak technical momentum, and profit-booking activity after recent consolidation. - What are the important support levels for Astral stock?
Immediate support is placed near ₹1,320, followed by a broader support zone around ₹1,235. - What does the RSI indicate for Astral shares?
The RSI near 33 suggests weakening momentum and signals near-term cautious market sentiment.