
Highlights
- CyberTech Systems shares surged nearly 15% with strong expansion in trading activity.
- Stock moved decisively above its 50-day SMA and approached fresh multi-week highs.
- RSI crossed above the 70 mark, reflecting elevated momentum conditions.
Overview
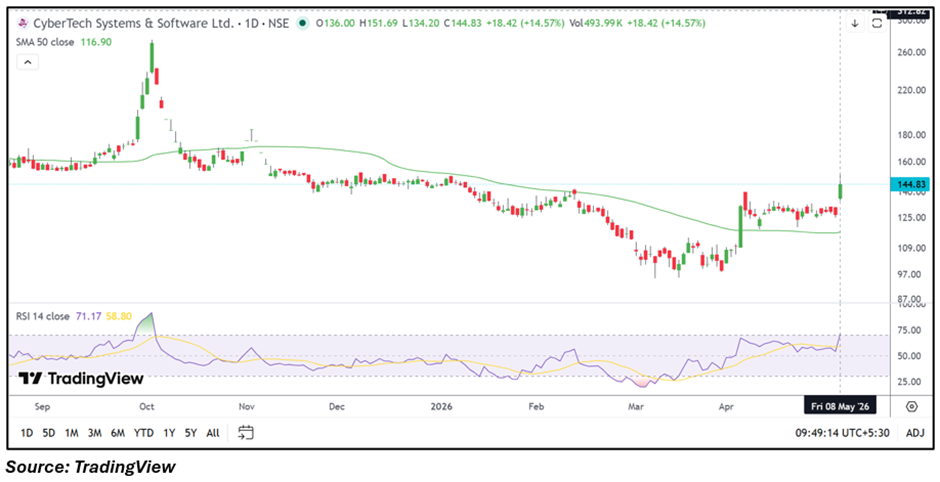
CyberTech Systems (NSE: CYBERTECH) gained 14.71% on May 8, 2026, touching an intraday high of ₹151.69 during strong momentum-led trade. The stock opened at ₹136.00 against the previous close of ₹126.41 and remained among the top gainers in the session.
The rally pushed the stock firmly above its 50-day simple moving average near ₹116.90, improving the near-term technical structure after a prolonged consolidation phase. Trading volumes also expanded notably alongside the sharp upward move.
Fundamental View
For the quarter ended December 31, 2025, CyberTech Systems reported consolidated total income of INR 6,384.22 lakh. Profit before tax stood at INR 843.89 lakh, while net profit came at INR 653.35 lakh. Earnings per share for the quarter was reported at INR 2.10.
Market participants continue monitoring demand trends in geospatial technology, enterprise digital solutions, smart city-related projects, and IT spending visibility across domestic and international markets.
Technical View
CyberTech Systems is trading near ₹145.00, up 14.71%, and remains firmly above its 50-day SMA around ₹116.90, indicating a significantly improved near-term setup. Price action reflects a breakout move after the stock consolidated near the ₹120–₹135 range over recent weeks.
The 14-day RSI has climbed near 71.17, suggesting momentum has strengthened sharply and entered elevated territory following the latest rally. The stock also approached fresh multi-week highs amid increased volatility and strong directional movement.
Momentum Indicator
The RSI has crossed above the 70 level, indicating accelerated momentum conditions. Elevated RSI readings may also keep short-term volatility active near resistance levels.
Key Technical Levels
- Immediate Support: ₹135.00
- Secondary Support: ₹128.00
- Immediate Resistance: ₹159.00
- Higher Resistance: ₹170.00
Risks To Watch
- Elevated RSI may trigger short-term profit booking.
- Sharp volatility can increase near resistance zones.
- Sustaining momentum above ₹135 remains technically important.
- IT spending slowdown may impact business visibility.
Summary
CyberTech Systems shares jumped as strong momentum and higher trading volumes drove the stock into a breakout zone above key technical level. The move strengthened the near-term setup and pushed the RSI into elevated territory. Traders may watch resistance at ₹159–₹170 and support near ₹135 for the next directional cues.
FAQs
Why did CyberTech Systems shares rise sharply today?
The stock rallied after witnessing strong momentum-driven buying activity and a breakout above important technical levels.
What are the important support levels for CYBERTECH?
Immediate support is placed near ₹135, while the next important support zone is around ₹128.
Why is RSI important for CyberTech Systems currently?
RSI above 71 indicates elevated momentum and suggests the stock may remain volatile in the near term.