
Highlights
- Ester Industries Limited declined around 6.64% in the latest session, reflecting continued weakness after failing to sustain higher levels.
- The stock remains below its 50-day Simple Moving Average near ₹96.17, indicating that the broader trend is still under pressure.
- Q3 FY26 results show a sharp decline in profitability, with EBITDA and PAT weakening year-on-year.
- Technical indicators show soft momentum, with RSI near 36.77, suggesting weak recovery signals.
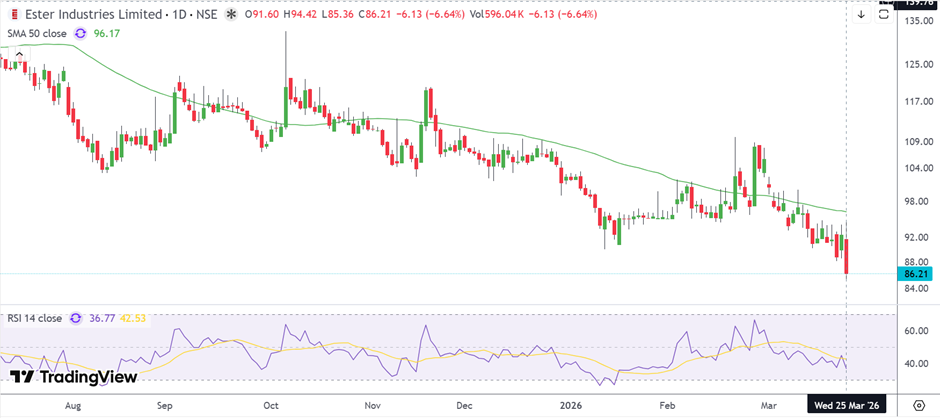
Shares of Ester Industries (NSE:ESTER) fell nearly 6.64% to trade near ₹86.21 as of March 25, 2026, extending its corrective phase after failing to hold recent gains. The stock continues to trade below its 50-day Simple Moving Average of ₹96.17, confirming that the broader trend remains weak. The price action indicates that sellers are still dominating at higher levels, while buyers are unable to sustain upward momentum, keeping the stock under pressure in the near term.
Financial Performance Shows Weak Profitability
Ester Industries Limited reported weak financial performance in Q3 FY26, with both revenue and profitability declining year-on-year. Total income stood at ₹254 crore compared to ₹277.3 crore in Q3 FY25, reflecting an 8.4% decline. EBITDA fell sharply to ₹14.3 crore from ₹44.3 crore, indicating a significant drop in operating profitability. Profit after tax turned negative at ₹4.9 crore compared to a profit of ₹18.6 crore in the same quarter last year, highlighting earnings pressure.
On a nine-month basis, total income declined to ₹802.3 crore from ₹823.6 crore, while PAT also weakened significantly, reflecting continued margin stress. The company noted that performance was impacted by lower BOPET film sales volumes, margin pressure due to global trade dynamics, and weaker contribution from specialty films, although domestic pricing discipline and rPET volumes showed some improvement.
Revenue and Margin Trends
Revenue decline was driven by lower volumes in BOPET films and pressure from global pricing conditions, particularly due to trade-related factors and competitive dumping. EBITDA margin dropped to 5.7% from 15.9% year-on-year, reflecting sharp compression in operating efficiency.
Even adjusted figures remained lower due to forex-related losses and one-time employee cost impacts. However, certain segments like specialty polymers and rPET showed strong growth, indicating partial structural improvement within the business mix.
Technical Setup Shows Weak Momentum
Ester Industries (NSE:ESTER) is currently trading near ₹86.21 as of March 25, 2026, slipping around 6.64%, reflecting continued weakness after failing to hold recent levels. The price action remains positioned below its 50-day Simple Moving Average near ₹96.17, indicating the overall trend remains under pressure.
The recent decline suggests lack of strength at higher levels, with sellers maintaining control in the near term. The 14-day RSI near 36.77 points to soft momentum without a clear recovery signal. In the near term, support is placed around ₹80.00–₹75.00, while resistance is seen near ₹92.00–₹98.00.
Source: TradingView
Outlook Hinges on Stabilisation
In the near term, the stock’s direction will depend on whether it can hold key support zones and stabilize after continued declines. A meaningful recovery would require sustained improvement in margins and a breakout above ₹98 levels. However, ongoing pressure in global margins and weak earnings visibility may limit upside potential in the short term.
Risk Factors to Watch
- Weak EBITDA and negative PAT in Q3 FY26 indicate earnings stress.
- Stock remains below its 50-day moving average, confirming a bearish trend.
- Margin pressure due to global trade conditions and pricing competition.
- Recovery depends on sustained improvement in core segment performance.
FAQs
Why did Ester Industries shares fall today?
The stock declined around 6.64% due to continued selling pressure and weak earnings performance.
What is the key resistance level?
Immediate resistance is placed in the ₹92–₹98 range.
Is Ester Industries profitable?
In Q3 FY26, the company reported a net loss, reflecting short-term profitability pressure.