
Highlights
- Everest Industries shares declined 5.00% to ₹502.55 during Thursday's session.
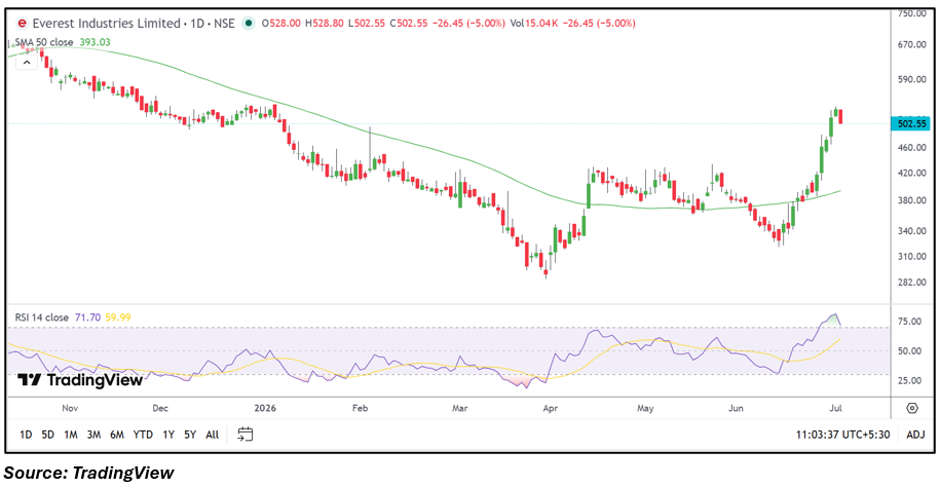
- The stock opened at ₹528.00 and slipped to an intraday low of ₹502.55.
- The company reported a consolidated net loss of ₹4,717.10 lakh for the March 2026 quarter.
- Total income for the latest quarter stood at ₹33,180.98 lakh.
- The stock continued to trade above its 50-day Simple Moving Average despite the day's decline.
- The 14-day RSI remained near 71.70, indicating elevated short-term momentum.
Overview
Everest Industries Limited witnessed a sharp decline during Thursday's trading session, with the stock falling 5.00% to ₹502.55 after opening at ₹528.00. The decline came after a strong upward move over recent weeks, suggesting a pause in the recent price momentum. Despite the day's weakness, the stock continued to trade above its 50-day Simple Moving Average, indicating that the broader medium-term technical structure remained intact.
Fundamental View
Everest Industries operates in the building products and roofing solutions segment, catering to residential, commercial and industrial infrastructure projects. For the quarter ended March 2026, the company reported consolidated total income of ₹33,180.98 lakh. The company recorded a loss before tax of ₹4,208.27 lakh, while consolidated net loss stood at ₹4,717.10 lakh, resulting in earnings per share of -₹29.75. The financial performance reflects pressure on profitability, while future business trends are likely to be influenced by demand from the construction sector, raw material costs and execution across infrastructure-related projects.
Technical View
The latest trading session reflected a pullback following a sharp rally that had lifted the stock to multi-month highs. Even after the decline, Everest Industries remained above its 50-day Simple Moving Average of around ₹393.03, indicating that the broader price structure has not materially changed. The 14-day RSI was near 71.70, suggesting that momentum remained elevated despite easing from recent highs. Trading volumes remained active as the stock experienced increased price volatility during the session.
Key Technical Levels
Immediate support is placed near ₹490.00, followed by the next support around ₹465.00. On the upside, immediate resistance is seen near ₹530.00, while the next resistance is positioned around ₹555.00. Price movement around these levels may influence the stock's near-term trading range.
Risks to Watch
- Weakness in profitability and earnings.
- Changes in construction and infrastructure demand.
- Fluctuations in raw material prices.
- Delays in project execution.
- Broader market volatility.
Summary
Everest Industries witnessed a notable decline after a strong upward move in recent sessions, while the broader technical structure remained above its medium-term moving average. The latest quarterly results reflected pressure on earnings despite healthy revenue generation. Business performance, profitability trends, construction sector demand and overall market conditions are expected to remain key factors influencing the stock's movement.
FAQs
Q: What does Everest Industries do?
Everest Industries manufactures roofing products, building solutions, pre-engineered buildings and other construction-related products.
Q: Why did Everest Industries shares fall today?
The stock declined 5.00% after a strong rally in recent weeks, reflecting a moderation in short-term price momentum.
Q: How did Everest Industries perform in the latest quarter?
For the March 2026 quarter, the company reported consolidated total income of ₹33,180.98 lakh and a net loss of ₹4,717.10 lakh.
Q: What does the current technical setup indicate?
The stock continues to trade above its 50-day Simple Moving Average, while the RSI remains elevated near 71.70, reflecting strong but moderating momentum.
Q: Which factors could influence Everest Industries going forward?
Construction sector demand, profitability trends, raw material costs, project execution and broader market conditions are expected to remain key variables.