
Highlights
- Ganesha Ecosphere (NSE: GANECOS) gained 7.26% on Thursday.
- December quarter consolidated net profit stood at INR 474.84 lakh.
- The stock surged above INR 1,000.00 after a recent rebound.
Ganesha Ecosphere (NSE: GANECOS) traded higher on 2 April 2026, with the stock moving near INR 1,096.50, up 7.26% from its previous close of INR 1,022.20. The stock opened at INR 1,010.00 and touched an intraday high of INR 1,109.75, while the day’s low stood at INR 976.55. VWAP for the session was recorded at INR 1,064.81.
The latest move extended the stock’s sharp recovery after it rebounded from the INR 650.00–700.00 region earlier this year. Ganesha Ecosphere (NSE: GANECOS) has also gained more than 25.00% over the previous five trading sessions.
Fundamental View: December Quarter Profit Remains Modest
For the quarter ended 31 December 2025, Ganesha Ecosphere (NSE: GANECOS) reported consolidated total income of INR 36,143.59 lakh. Profit before tax stood at INR 814.16 lakh, while net profit came in at INR 474.84 lakh. Earnings per share for the quarter was reported at INR 1.77.
The latest financial performance indicates that the company remained profitable during the quarter, although earnings remained relatively modest compared with the sharp rise in the share price.
Technical View: Sharp Momentum Continues After Crossing Above 50-Day Average
Ganesha Ecosphere (NSE: GANECOS) is currently trading near INR 1,096.50 and remains well above its 50-day Simple Moving Average near INR 769.86. The chart had been reflecting a prolonged decline for several months before the stock began to recover in February.
The latest rally has now pushed the stock above the earlier swing zone near INR 1,000.00 and closer to its recent high near INR 1,110.00. The broader structure has improved noticeably, with the stock now forming a sequence of higher highs and higher lows.
The 14-day RSI has climbed to around 79.09, indicating that momentum remains firm but is now in overbought territory. This suggests that short-term swings may remain elevated even as the broader trend continues to improve.
Key Technical Levels
At INR 1,096.50, immediate support is seen near INR 1,000.00, followed by stronger downside support around INR 950.00. On the upside, resistance is placed near INR 1,150.00–1,250.00.
A move above INR 1,150.00 may support a further rise toward INR 1,250.00, while a drop below INR 1,000.00 could slow the current rally.
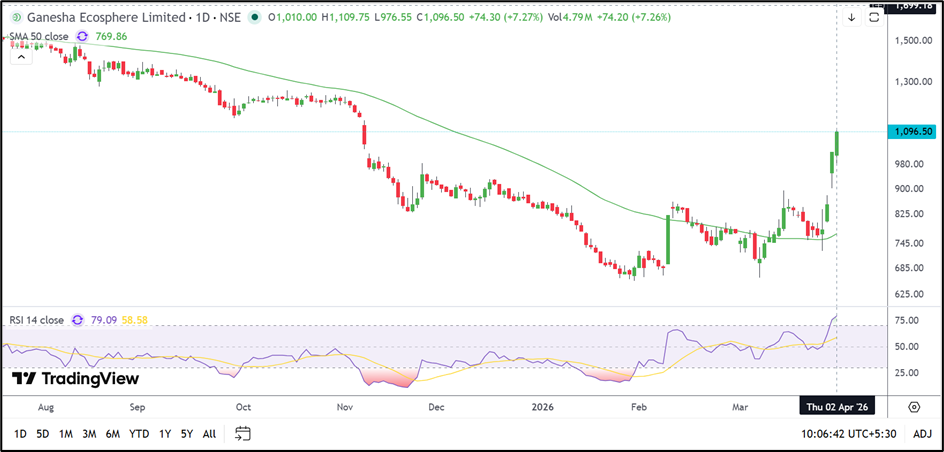
Source: TradingView
Key Risks
- RSI above 79 may keep near-term volatility elevated.
- Failure to hold above INR 1,000.00 may weaken momentum.
- Resistance near INR 1,150.00–1,250.00 may limit gains.
- Recent sharp gains may trigger profit-booking pressure.
Summary
Ganesha Ecosphere (NSE: GANECOS) rose 7.26% to INR 1,096.50 after extending its recent rally above INR 1,000.00. The stock now trades above its 50-day moving average near INR 769.86, while RSI near 79.09 indicates overbought conditions. Investors are likely to watch whether the stock can remain above INR 1,000.00.
FAQs
- Why did Ganesha Ecosphere shares rise today?
The stock gained after extending its rally above INR 1,000.00. - What was Ganesha Ecosphere’s December quarter net profit?
The company reported consolidated net profit of INR 474.84 lakh. - Which levels are important for Ganesha Ecosphere shares?
Support is near INR 1,000.00–950.00, while resistance is around INR 1,150.00–1,250.00.