
Highlights
- Mangalam Global Enterprise Ltd. declined around 7.13% in the latest session, indicating renewed weakness after a short recovery attempt.
- The stock is trading near its 50-day Simple Moving Average around ₹11.53, suggesting an unstable and fragile broader structure.
- RSI near 60.93 shows earlier momentum strength, but recent selling pressure indicates possible cooling.
Shares of Mangalam Global Enterprise (NSE:MGEL) fell around 7.13% to trade near ₹12.37 as of March 25, 2026, signaling renewed weakness after a brief upward move. The stock is currently hovering close to its 50-day Simple Moving Average of ₹11.53, indicating that the broader structure remains unstable and prone to volatility. The overall chart setup continues to reflect a downtrend with a pattern of lower highs and lower lows. The recent rejection from higher levels suggests that selling pressure is still active at resistance zones.
Financial Performance Shows Strong Operational Growth
Mangalam Global Enterprise Ltd. reported strong financial performance in Q3 FY26, with revenue and profitability showing steady growth. Total income stood at ₹62,347.96 lakh compared to ₹47,209.33 lakh in Q3 FY25, reflecting strong year-on-year growth in operations. Net profit for the quarter came in at ₹660.57 lakh versus ₹601.38 lakh in the same period last year, indicating stable profitability despite volatility. For the nine-month period, the company reported a net profit of ₹3,021.13 lakh compared to ₹1,662.68 lakh in the previous year, highlighting significant improvement in overall earnings performance.
Revenue and Expense Trends
Revenue from operations increased steadily to ₹62,004.80 lakh, supported by strong business activity and higher demand. On the cost side, total expenses rose to ₹61,556.03 lakh, driven primarily by raw material consumption and purchase of stock-in-trade. However, efficient cost balancing helped maintain profitability. Finance costs remained controlled at ₹656.69 lakh, while depreciation and other expenses showed moderate movement, indicating stable operational efficiency.
Technical Setup Shows Continued Volatility
Mangalam Global Enterprise (NSE:MGEL) is currently trading near ₹12.37 as of March 25, 2026, declining around 7.13%, indicating renewed weakness after a brief upward move. The price continues to trade around its 50-day Simple Moving Average near ₹11.53, suggesting an unstable broader structure.
The chart reflects a prevailing downtrend with lower highs and lower lows, and the recent sharp move appears to be facing resistance near higher levels rather than sustaining gains. The 14-day RSI near 60.93 shows momentum has picked up but may cool off after the recent rise. In the near term, support is placed around ₹11.00–₹10.00, while resistance is seen near ₹14.00–₹15.00.
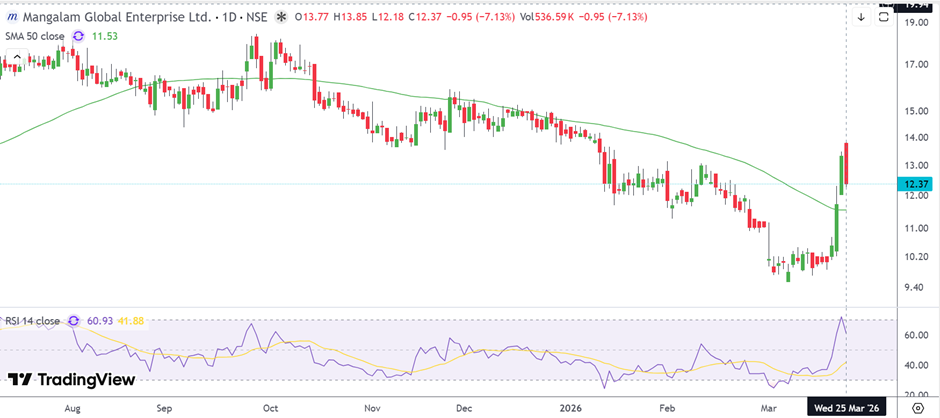
Source: TradingView
Outlook Hinges on Trend Stabilisation
In the near term, the stock’s direction will depend on whether it can stabilise above its 50-day moving average and avoid further breakdowns. While financial performance remains strong, price action still lacks confirmation of a trend reversal. A sustained breakout above resistance will be necessary to re-establish bullish momentum.
Risk Factors to Watch
- Persistent downtrend structure with lower highs and lower lows.
- Failure to sustain above key resistance zones.
- Dependence on broader market sentiment for recovery continuation.
FAQs
Why did Mangalam Global Enterprise shares fall today?
The stock declined around 7.13% due to profit booking and resistance at higher levels after a short recovery move.
Is Mangalam Global Enterprise financially strong?
Yes, the company reported strong revenue growth and improving net profit in FY26 results.
What is the key resistance level?
Immediate resistance is placed in the ₹14–₹15 range.