
Highlights
- The stock is trading above its 50-day SMA, indicating gradual recovery in trend.
- RSI reflects moderate strength, suggesting room for further upside movement.
- Resistance levels ahead may limit immediate gains and trigger consolidation.
Sakuma Exports Limited (NSE:SAKUMA) is trading near INR 2.02, reflecting a marginal gain of around 0.50% in the latest session. The stock is holding slightly above its 50-day simple moving average at INR 1.78, indicating that the broader structure is attempting to stabilise after a prior downtrend.
The stock has recovered from its 52-week low of INR 1.10 recorded in March 2026 and is currently trading within a narrow range. Immediate support is placed in the INR 1.90–1.75 zone, while resistance is seen between INR 2.20 and INR 2.40, which may act as a near-term barrier.
Momentum Indicators Indicate Moderate Strength
The 14-day Relative Strength Index (RSI) stands near 62.27, indicating moderate momentum with scope for further upside. This level suggests that buying interest is present without entering overbought territory.
The intraday range between INR 1.93 and INR 2.05 highlights relatively controlled volatility. The VWAP at INR 2.01 indicates that the stock is trading close to its average traded price, reinforcing the ongoing consolidation phase. Daily volatility stands at 3.71, while annualised volatility is elevated at 70.88, indicating potential for price swings.
Returns Reflect Mixed Performance
Sakuma Exports has shown mixed returns across timeframes. Over the past week, the stock declined 2.88%, underperforming the NIFTY 50, which gained 1.22%. However, on a one-month basis, the stock has risen 36.49%, significantly outperforming the broader market.
Year-to-date returns stand at -5.16%, compared to a decline of -6.89% in NIFTY 50, indicating relative resilience. Over longer periods, the stock has declined 26.28% over one year and 17.21% over three years. However, five-year returns remain positive at 108.25%, outperforming the benchmark over that period.
Business Overview and Trading Activity
Sakuma Exports Limited operates in the trading and export of bulk agricultural commodities, including sugar, edible oils, oil seeds, pulses, and cotton. The company also offers structured financial products linked to physical commodities.
The stock recorded traded volume of 11.08 lakh shares, translating into a traded value of INR 0.22 crore. The total market capitalisation stands at INR 316.68 crore, with free float market cap at INR 170.09 crore. The impact cost of 0.56 indicates moderate liquidity conditions.
Technical Summary
Sakuma Exports Limited is trading near ₹2.02, up around 0.50%, and is holding slightly above the 50-day SMA near ₹1.78, with the 14-day RSI near 62.27 points to moderate strength with room for further upside. Immediate support is placed in the ₹1.90–1.75 zone, while resistance is seen near the ₹2.20–2.40 range.
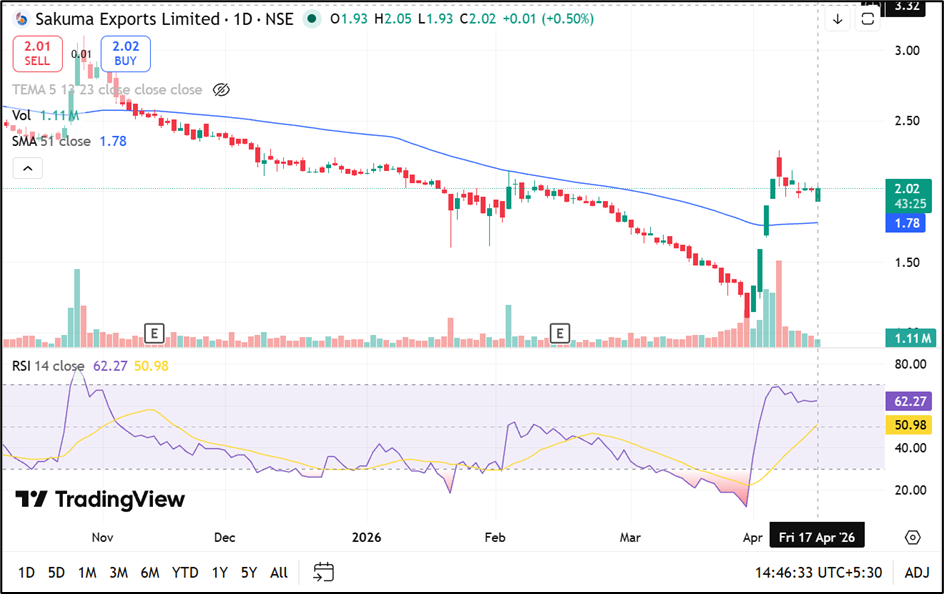
Source: TradingView
Key Risks to Monitor
- Resistance zone near INR 2.20–2.40 may cap near-term upside.
- Moderate volatility may lead to sudden price fluctuations.
- Weak long-term returns may affect investor sentiment.
- Narrow price range suggests lack of strong directional momentum.
Summary
Sakuma Exports Limited is currently trading slightly above its 50-day SMA, indicating a gradual stabilisation in trend. Momentum indicators reflect moderate strength, leaving room for further upside, although resistance levels ahead may limit gains. Mixed return profile and volatility conditions suggest that the stock may continue to trade within a defined range in the near term.
FAQs
What does trading above the 50-day SMA indicate?
It suggests a potential stabilisation in trend, indicating recovery from earlier price weakness.
Is RSI near 62 supportive of further upside?
Yes, it indicates moderate momentum with room for gradual upward movement without being overbought.
What are the key support and resistance levels?
Support is placed at INR 1.90–1.75, while resistance is seen between INR 2.20 and INR 2.40.