
Highlights
- Sammaan Capital stock surged over 11% intraday, indicating strong recovery momentum.
- Q3 FY26 profit remained stable with improved overall financial position.
- Technical indicators show strengthening momentum, with resistance near ₹175–₹190.
Shares of Sammaan Capital Ltd (NSE:SAMMAANCAP) rose around 11.04% to trade near ₹153.80 on March 25, 2026, on the National Stock Exchange (NSE). The stock has moved above its 50-day Simple Moving Average of ₹144.81, indicating an improvement in the near-term setup. The price action shows a rise from the support zone, with the move above the 50-day SMA supporting the ongoing momentum. The stock is now approaching the upper end of its recent range, indicating strengthening price behaviour.
Financial Performance Reflects Stability
Sammaan Capital Ltd reported steady financial performance in Q3 FY26. Total income for the quarter stood at ₹2,157.87 crore compared to ₹2,019.14 crore in the corresponding period last year. Profit before tax came in at ₹419.07 crore versus ₹417.25 crore year-on-year, indicating stable earnings. Net profit for the quarter stood at ₹308.47 crore compared to ₹302.44 crore in Q3 FY25. For the nine-month period, the company reported a net profit of ₹956.86 crore compared to a loss of ₹2,131.51 crore in the prior corresponding period, reflecting a significant turnaround.
Revenue Mix and Expense Trends
Revenue from operations was supported by interest income of ₹1,500.16 crore and gains from financial instruments. Fees and commission income also improved during the quarter. On the cost side, finance costs increased to ₹1,457.67 crore, reflecting higher borrowing expenses. However, impairment on financial instruments showed improvement compared to previous periods, supporting profitability. Employee benefit expenses declined, indicating better cost management.
Trading Activity Signals Strong Buying Interest
The sharp rise in the stock price highlights renewed buying interest after a consolidation phase. Moving above the 50-day moving average often signals strengthening sentiment and potential continuation of upward momentum, provided buying support persists.
Technical Setup Shows Strengthening Momentum
Sammaan Capital Ltd is currently trading near ₹153.80 as of March 25, 2026, gaining around 11.04%, and has moved above its 50-day Simple Moving Average near ₹144.81, indicating an improvement in the near-term setup. The price action shows a rise from the support zone, with the move above the 50-day SMA supporting the ongoing momentum.
The price is now approaching the upper end of its recent range, indicating strengthening price behaviour. The 14-day RSI near 59.75 signals improving momentum, approaching the higher zone. In the near term, support is placed around ₹134.00–₹120.00, while resistance is seen near ₹175.00–₹190.00.
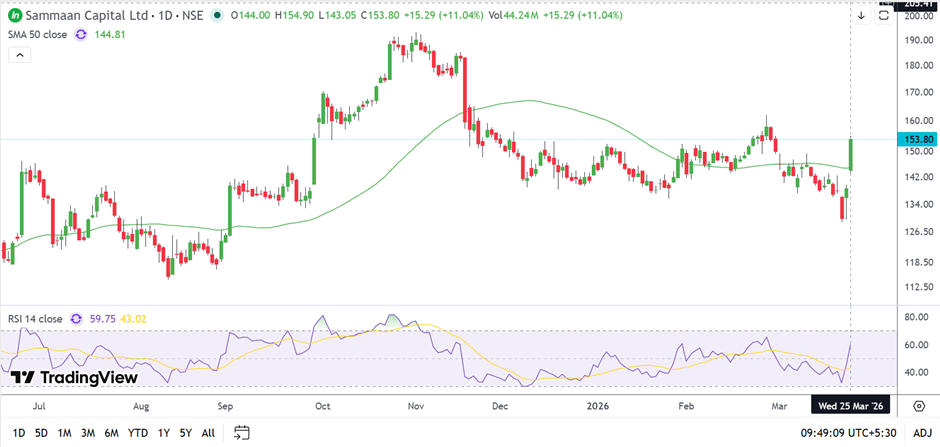
Source: TradingView
Outlook Hinges on Sustained Momentum
In the near term, the stock’s direction may depend on its ability to sustain above the 50-day moving average and break past key resistance levels. Continued improvement in asset quality and earnings stability may support further upside.
Risk Factors to Watch
- Rising finance costs could impact margins going forward. · Resistance near ₹175–₹190 may limit near-term upside. · Sustaining momentum above key levels remains critical.
Sammaan Capital Ltd’s recent rally reflects improving sentiment supported by a technical breakout above key levels. While financial performance shows stability and recovery, sustained upside may depend on continued momentum and earnings consistency.
FAQs
Why did Sammaan Capital shares rise today?
The stock gained due to strong buying interest and a breakout above the 50-day moving average.
What are the key resistance levels for Sammaan Capital stock?
The stock faces resistance between ₹175 and ₹190 in the near term.
How did Sammaan Capital perform in Q3 FY26?
The company reported stable profit and a significant turnaround in nine-month earnings.