
Highlights
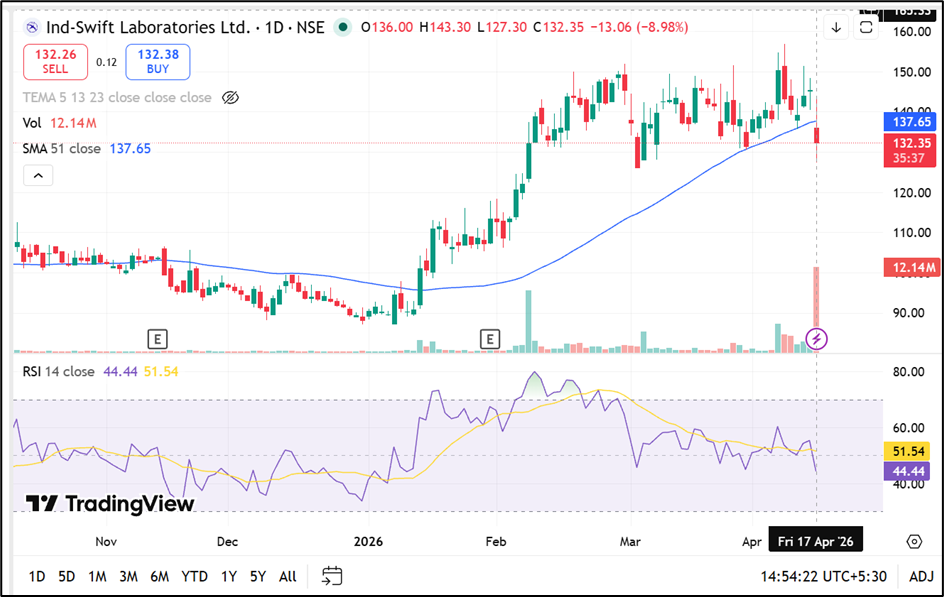
- The stock has declined sharply and moved below its 50-day SMA, signaling weakness.
- RSI indicates fading momentum, suggesting potential downside pressure in the near term.
- Key support levels are approaching, which may lead to short-term stabilization.
Ind-Swift Laboratories (NSE:INDSWFTLAB) is trading near INR 132.35, reflecting a decline of around 8.98% in the latest session. The stock has slipped below its 50-day simple moving average at INR 137.65, indicating that the broader structure is weakening after a prior uptrend.
The recent fall comes after the stock touched its 52-week high of INR 156.80 earlier in April 2026. Prices are now approaching a key support zone between INR 125.00 and INR 118.00, which may act as a cushion against further downside. On the upside, resistance is seen between INR 140.00 and INR 150.00.
Momentum Indicators Reflect Weakness
The 14-day Relative Strength Index (RSI) stands near 44.44, indicating weakening momentum and a shift away from bullish territory. This level suggests that selling pressure has increased, with potential for further downside if momentum does not stabilise.
The intraday price range between INR 127.30 and INR 143.30 highlights elevated volatility. The VWAP at INR 134.79 suggests that current trading levels are slightly below average traded prices, reinforcing the negative bias. Daily volatility stands at 3.25, while annualised volatility is at 62.09, indicating significant price fluctuations.
Returns Remain Strong Despite Recent Decline
Ind-Swift Laboratories has delivered strong returns across longer timeframes despite recent weakness. The stock has declined 6.05% over the past week and 9.46% over the past month, underperforming the NIFTY 50.
However, year-to-date returns stand at 45.95%, significantly outperforming the broader market, while one-year returns are at 51.61%. Over three and five years, the stock has gained 101.02% and 82.67% respectively, indicating sustained long-term performance.
Trading Activity and Liquidity Trends
The stock recorded traded volume of 121.45 lakh shares, translating into a traded value of INR 163.70 crore. The total market capitalisation stands at INR 1,145.20 crore, with free float market cap at INR 515.18 crore.
The impact cost of 0.23 indicates relatively good liquidity, while deliverable quantity at 46.67% suggests balanced participation between traders and investors.
Technical Summary
Ind-Swift Laboratories (NSE:INDSWFTLAB) is trading near ₹132.35, down around 8.98%, and has slipped below the 50-day SMA near ₹137.65, with the 14-day RSI near 44.44 points to weakening momentum with room for further downside if selling pressure persists. Immediate support is placed in the ₹125.00–118.00 zone, while resistance is seen near the ₹140.00–150.00 range.
Source: TradingView
Key Risks to Monitor
- Breakdown below 50-day SMA may signal further downside risk.
- Weak RSI indicates fading momentum and continued selling pressure.
- Support zone near INR 125–118 is critical for near-term stability.
- Elevated volatility may lead to sharp price swings.
Summary
Ind-Swift Laboratories (NSE:INDSWFTLAB) has slipped below its 50-day SMA, indicating weakening price structure after a prior uptrend.
Momentum indicators suggest continued pressure, although key support levels may provide near-term stability. Despite recent declines, long-term returns remain strong, but near-term direction will depend on how prices react around support zones.
FAQs
What does falling below the 50-day SMA indicate?
It signals weakening trend conditions, suggesting potential downside or continuation of correction in the near term.
Is RSI near 44 a bearish signal?
It indicates weakening momentum, with room for further downside if selling pressure continues.
What are the key support and resistance levels?
Support is placed at INR 125–118, while resistance is seen between INR 140 and INR 150.