
Highlights
- Jay Bharat Maruti shares hit the 20% upper circuit after Q4 earnings announcement.
- The stock moved above its 50-day SMA as momentum indicators turned sharply higher.
- Q4 standalone net profit stood at INR 7,885.79 million with elevated trading activity.
Overview
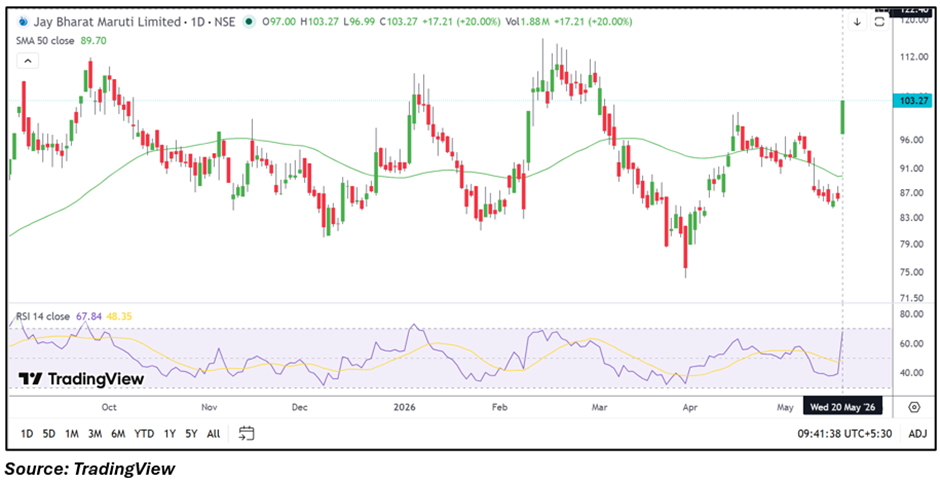
Jay Bharat Maruti Limited (NSE: JAYBARMARU) shares surged 20.00% to INR 103.27 on May 20, 2026, emerging among the top gainers on the NSE after the company announced its March quarter earnings. The stock opened at INR 97.00 and touched an intraday high of INR 103.27 during the trading session.
The company reported standalone total income of INR 76,697.57 million for the quarter ended March 2026. Profit before tax came at INR 5,531.80 million, while net profit stood at INR 7,885.79 million. Earnings per share for the quarter was reported at INR 7.28.
Fundamental View
Jay Bharat Maruti operates in the automobile components segment and manufactures exhaust systems, sheet metal components, polymer products, and assemblies for passenger vehicle manufacturers.
The latest quarterly numbers reflected improved profitability and triggered heightened market activity in the stock. Investors are likely to monitor demand trends in the passenger vehicle segment, raw material movement, and order flow from automobile manufacturers in coming quarters.
Technical View
Jay Bharat Maruti is currently trading above its 50-day SMA near INR 89.70, reflecting an improved near-term structure after recent consolidation around lower levels. The sharp upward move has pushed the stock back above the psychological INR 100 mark, indicating renewed momentum after several sessions of muted price action.
The 14-day RSI climbed near 67.84 and moved above its signal line, reflecting strengthening momentum conditions. The momentum oscillator also turned sharply higher from lower zones, indicating improving short-term price strength and increased trading activity following the earnings announcement.
Key Technical Levels
Jay Bharat Maruti has immediate support placed near INR 95.00, while the stronger support zone is seen around INR 90.00. On the upside, the stock may face immediate resistance near INR 109.00, followed by the INR 115.00 zone, which could remain important for further price expansion in the near term.
Key Risks
- Weak passenger vehicle demand may affect order growth.
- Rising raw material prices could pressure margins.
- Dependence on major automobile OEMs remains elevated.
- Sharp rally may trigger near-term volatility.
Summary
Jay Bharat Maruti (NSE: JAYBARMARU) witnessed a sharp rally following its March quarter earnings announcement, with the stock hitting the 20% upper circuit during Wednesday’s session. The stock has moved above its 50-day SMA while RSI and momentum oscillators also improved notably. Traders may now monitor whether the stock sustains above the INR 100 zone, while resistance around INR 109–115 could remain important in the near term.
FAQs
- Why did Jay Bharat Maruti shares rise today?
The stock surged after the company reported its March 2026 quarterly earnings and improved profitability figures. - What is the key support zone for JAYBARMARU stock?
The immediate support zone for the stock is placed between INR 95 and INR 90. - What resistance levels should traders watch in Jay Bharat Maruti?
The stock may face near-term resistance around INR 109 and the INR 115 zone.