
Highlights
- The stock declined nearly 5% while holding above its 50-day moving average.
- RSI eased near mid-levels, indicating moderation in short-term price momentum.
- Support and resistance zones suggest consolidation phase after recent upward movement.
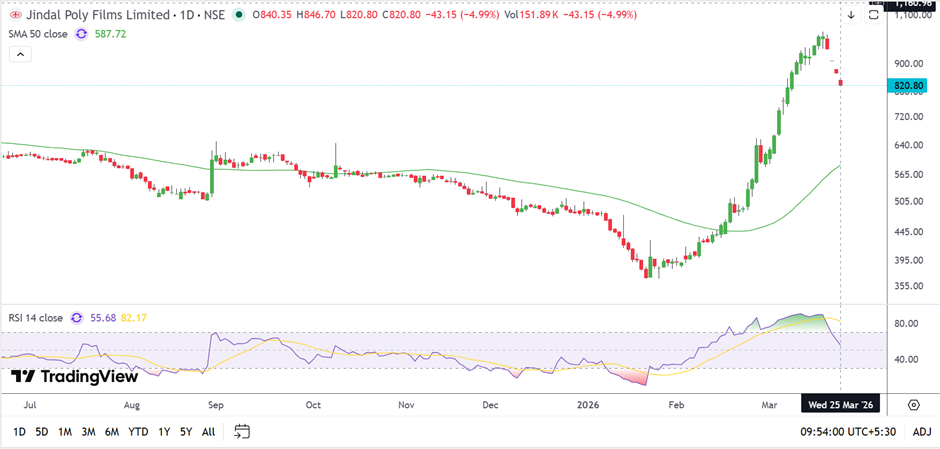
Jindal Poly Films Limited (NSE:JINDALPOLY) traded near ₹ 820.80 on March 25, 2026, marking a decline of around 4.99% during the session. Despite the recent fall, the stock remains well above its 50-day Simple Moving Average near ₹ 587.72, indicating that the broader trend has not weakened. The price movement reflects a sharp upward trajectory in previous sessions, followed by a pullback from higher levels. Such a pattern suggests a pause or consolidation phase rather than a complete reversal. The stock continues to hold above important technical levels, pointing to underlying stability in the current structure.
Momentum Indicators Signal Moderation
The 14-day Relative Strength Index (RSI) is currently positioned near 55.68. This indicates that momentum has eased from earlier elevated levels and is now in a neutral zone. A mid-range RSI typically reflects balanced buying and selling pressure. It may also indicate that the stock is transitioning from a strong upward move into a consolidation range, where directional clarity could emerge over the near term.
Key Support and Resistance Levels
Jindal Poly Films Limited is currently trading near ₹820.80 as of March 25, 2026, declining around 4.99%, while remaining well above its 50-day Simple Moving Average near ₹587.72, indicating a positive broader setup. The price action reflects a sharp upward move followed by a recent pullback from higher levels, suggesting a pause after the rally.
Despite the decline, the price continues to hold above key levels, indicating underlying stability. The 14-day RSI near 55.68 has eased from higher levels, pointing to moderation in momentum. In the near term, support is placed around ₹740.00–₹680.00, while resistance is seen near ₹880.00–₹950.00.
Source: TradingView
Financial Performance Snapshot
For the quarter ended December 31, 2025, the company reported total income of ₹ 10,472.38 lakh. Total expenses stood at ₹ 9,249.24 lakh, leading to a profit before tax of ₹ 9,245.18 lakh after exceptional items adjustment. Tax expenses impacted the final outcome, resulting in a net profit from continuing operations of ₹ 7,339.55 lakh. Including discontinued operations, total comprehensive income for the period reached ₹ 7,572.37 lakh.
On a nine-month basis ending December 31, 2025, total income stood at ₹ 35,508.49 lakh, while net profit for the period was reported at ₹ 15,293.77 lakh.
Key Risks
- Price volatility may increase near resistance zones, limiting upward movement.
- Declining momentum indicators could signal extended consolidation or further downside.
- Dependence on cost structures may impact profitability during fluctuating input prices.
- Financial performance variations across quarters may affect investor sentiment.
Summary
Jindal Poly Films stock remains above key moving averages despite a recent decline, indicating stability in the broader trend. Momentum has moderated, with RSI near neutral levels. Technical indicators suggest a consolidation phase between defined support and resistance zones. Financial data reflects continued profitability, though quarterly variations and technical resistance levels remain important factors influencing near-term price direction.
FAQs
- What is the current trend of Jindal Poly Films stock?
The stock shows a broader upward trend but recently entered a consolidation phase after a sharp rally. - What are the important support and resistance levels?
Support lies between ₹ 740 and ₹ 680, while resistance is seen in the ₹ 880 to ₹ 950 range. - What does the RSI indicate for the stock?
The RSI near 55 suggests neutral momentum, indicating neither overbought nor oversold conditions currently.