
Highlights
- Jyoti CNC Automation Limited shares plunged 13.07% to ₹711.75 on April 13, 2026.
- The stock erased last week’s rebound and slipped back below its 50-day SMA near ₹795.23.
- Weak momentum and heavy selling pressure dragged the stock near its recent March lows.
Overview
Jyoti CNC Automation Limited (NSE: JYOTICNC) dropped 13.07% to ₹711.75 on April 13, 2026, after opening at ₹761.40 and touching an intraday low of ₹691.90. The stock witnessed intense selling through the session and emerged among the top losers in the market.
The sharp fall came after the stock had attempted a short-lived recovery over the past few sessions. However, that rebound failed near the 50-day Simple Moving Average, and the latest decline suggests that sellers have regained control.
Fundamental View
Jyoti CNC Automation reported strong consolidated earnings for the December 2025 quarter. The company posted total income of ₹58,195.00 lakh, while profit before tax stood at ₹12,375.00 lakh.
Net profit came in at ₹8,851.00 lakh and earnings per share stood at ₹3.89. Despite the healthy financial performance, the stock has remained under pressure due to weak market sentiment and the recent breakdown on the chart.
Technical View
Jyoti CNC Automation had been attempting to recover from its March decline, but the rebound lost momentum as soon as the stock approached the 50-day Simple Moving Average near ₹795.23. The failure to cross that barrier triggered a fresh wave of selling.
The latest candle is one of the sharpest declines seen in recent weeks, with the stock falling from above ₹760.00 to below ₹720.00 in a single session. The breakdown also pushed the price back toward the lower end of its recent trading band.
The 14-day RSI has slipped to 39.80 and moved below its signal line, reflecting a renewed loss of momentum. Unlike earlier declines, the current fall comes after an unsuccessful rebound attempt, which may keep sentiment weak in the near term.
Key Technical Levels
The stock may now look toward the ₹660.00–615.00 zone if the current weakness continues. On the higher side, any recovery attempt may face pressure around ₹765.00–800.00, where the stock struggled in the latest rebound phase.
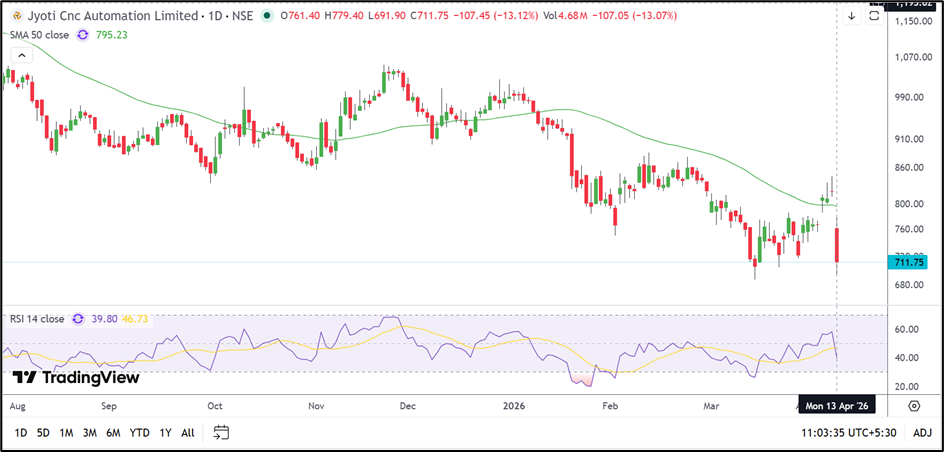
Source: TradingView
Risk to Watch
- The stock has fallen sharply below its 50-day SMA, which may keep pressure on sentiment.
- Continued weakness in momentum could drag the stock closer to its recent lows.
- Any further rise in volatility may lead to wider price swings in the near term.
- Despite strong earnings, the market may continue to focus more on the weak chart structure.
Summary
Jyoti CNC Automation has witnessed a sharp reversal after failing to sustain its recent rebound. The stock has slipped below the 50-day SMA and momentum indicators have weakened again. While the company’s earnings remain strong, the near-term chart continues to indicate pressure unless the stock can stabilise and recover from current levels.
FAQs
Why did Jyoti CNC Automation share price fall today?
The stock fell sharply after its recent rebound failed near the 50-day SMA, leading to renewed selling pressure.
What is the 50-day SMA for Jyoti CNC Automation?
The 50-day Simple Moving Average for Jyoti CNC Automation is currently near ₹795.23.
How much net profit did Jyoti CNC Automation report in December 2025?
Jyoti CNC Automation reported a consolidated net profit of ₹8,851.00 lakh in the December 2025 quarter.