
Highlights
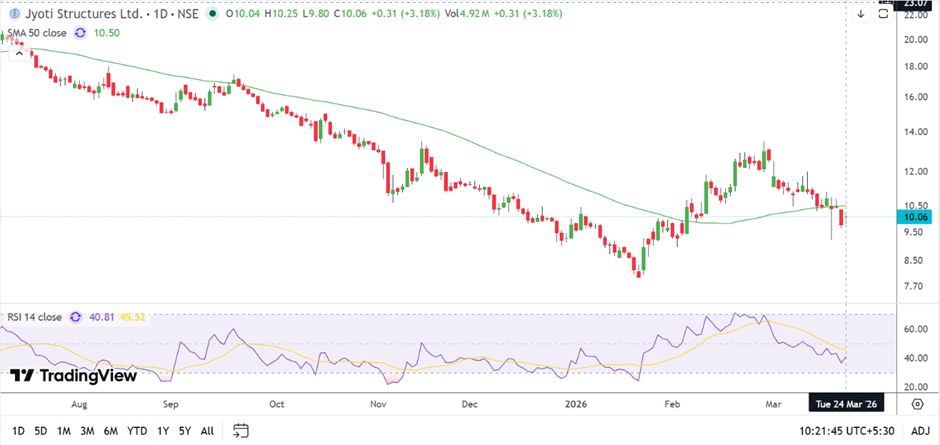
- Jyoti Structures stock gained over 3% intraday but remains below its 50-day average.
- Technical indicators show weak momentum, with RSI hovering near the lower range.
- Price structure continues to reflect a downtrend, with resistance likely near ₹11.50–₹12.40.
Shares of Jyoti Structures Ltd (NSE:JYOTISTRUC) rose around 3.18% to trade near ₹10.06 on March 24, 2026, on the National Stock Exchange (NSE). Despite the intraday gain, the stock continues to trade below its 50-day Simple Moving Average of ₹10.50, indicating that the broader trend remains weak.
The price structure reflects a pattern of lower highs and lower lows, maintaining a downward bias. A recovery observed in February appears to have faded, with recent sessions showing renewed selling pressure and lack of sustained follow-through.
Sector Context and Business Exposure
Jyoti Structures operates in the power transmission and infrastructure segment, where performance is often linked to project execution, order inflows, and capital expenditure cycles.
Delays in project execution or variability in order pipelines can impact revenue visibility and overall performance in such sectors.
Trading Behaviour Reflects Limited Participation
The recent uptick in share price suggests some buying interest at lower levels. However, the inability to move above key averages indicates that broader participation remains cautious.
Such movements are typically associated with short-term trading activity rather than a sustained shift in trend.
Technical Setup Signals Subdued Momentum
Jyoti Structures Ltd. is trading near ₹10.06 as of March 24, 2026, up 3.18% for the session, but remains below its 50-day Simple Moving Average near ₹10.50, indicating a weak broader trend. The price structure still reflects lower highs and lower lows, keeping the overall bias on the downside.
A recovery seen in February has faded, with recent sessions showing renewed pressure and lack of follow-through. Momentum remains subdued, with the 14-day RSI near 40.81, suggesting limited strength. Immediate support is placed around ₹9.00–₹8.20, while resistance is seen near ₹11.50–₹12.40 in the near term.
Source: TradingView
Outlook Remains Dependent on Break Above Resistance
In the near term, the stock’s movement may depend on its ability to sustain above resistance levels and improve momentum indicators. The current setup does not indicate a confirmed reversal, with the broader trend still reflecting weakness.
Market participants may continue to monitor price action and volume trends for signs of sustained recovery.
Risk Factors to Watch
- Ongoing downtrend with lower highs and lows limits upside visibility.
- Weak momentum indicators suggest lack of strong buying interest.
- Failure to cross key resistance levels may keep pressure on the stock.
Jyoti Structures Ltd (NSE:JYOTISTRUC) recent 3% rise reflects a short-term recovery attempt, but the broader technical structure remains weak. Continued pressure and lack of momentum indicate that caution remains relevant, with sustained upside dependent on a clear breakout and improved participation.
FAQs
- Why did Jyoti Structures shares rise today?
The stock gained due to short-term buying interest, though the broader trend remains weak and lacks sustained momentum. - What are the key resistance levels for Jyoti Structures stock?
The stock faces resistance between ₹11.50 and ₹12.40, which may cap near-term upside movement. - What does the RSI level indicate for Jyoti Structures?
An RSI near 40 suggests subdued momentum and limited buying strength, indicating the stock remains under pressure.