
Highlights
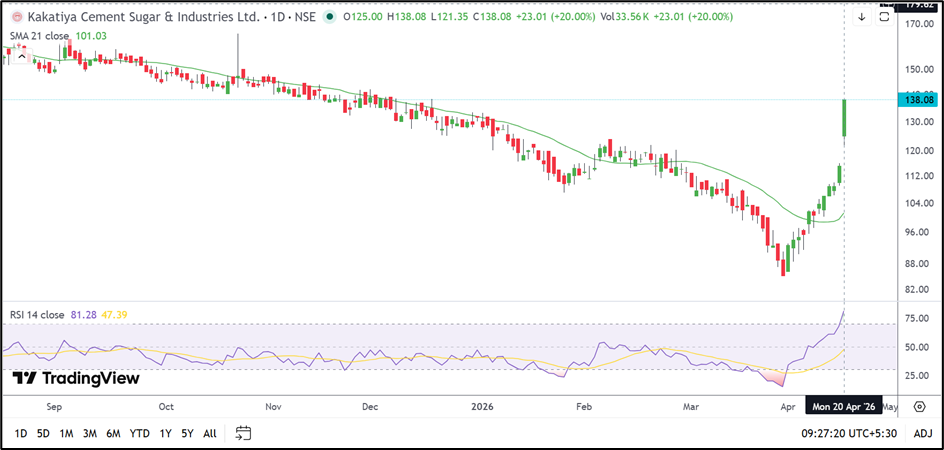
- Kakatiya Cement Sugar & Industries surged 20.00% to ₹138.08 on April 20, 2026.
- The stock moved decisively above its 21-day SMA of ₹101.03 after breaking past ₹120.00.
- Immediate support is placed at ₹125.00–115.00, while resistance is seen near ₹155.00–168.00.
Overview
Kakatiya Cement Sugar & Industries Limited (NSE: KAKATCEM) rallied 20.00% to ₹138.08 after opening at ₹125.00 and touching an intraday high of ₹138.08. The stock has now rebounded sharply from the March low near ₹86.00 and moved to its highest level in several months.
The latest move suggests that the market is beginning to reassess the earlier weak trend. The stock not only crossed the recent consolidation zone but also delivered a strong breakout above the ₹120.00 region.
Fundamental View
For the quarter ended December 2025, the company reported standalone total income of ₹1,510.47 lakh.
Loss before tax stood at ₹479.26 lakh, while net loss came in at ₹491.21 lakh. Earnings per share remained negative at ₹6.32.
Although the latest financial performance was weak, the recent rise in the share price indicates that traders are currently responding more to the improving chart structure than to the earnings profile.
Technical View
The technical picture has improved significantly after the latest rally. KAKATCEM is now trading well above its 21-day Simple Moving Average of ₹101.03, indicating that the short-term trend has turned higher.
The stock has also broken above the earlier swing zone near ₹120.00 with a wide bullish candle. This type of move often appears when a stock begins to reverse after a prolonged decline.
At the same time, momentum has become stretched. The 14-day RSI has climbed to 81.28, which places the stock in overbought territory and raises the possibility of short-term volatility or profit-booking.
Even so, the breakout may remain intact as long as the stock holds above the ₹125.00 area.
Key Technical Levels
The ₹125.00–115.00 region may now act as the first support zone if the stock starts to cool after the rally.
On the upside, the next resistance area is placed near ₹155.00–168.00. A move above ₹168.00 may open the door to a stronger extension in the coming sessions.
Source: TradingView
Summary
Kakatiya Cement Sugar & Industries has delivered one of its strongest rallies in recent months and appears to be entering a new short-term uptrend. While the very high RSI suggests that near-term pullbacks are possible, the broader structure has improved sharply. Traders may now watch whether the stock can continue to hold above ₹125.00 and extend toward the ₹155.00–168.00 zone.
FAQs
Why did Kakatiya Cement Sugar & Industries share price rise today?
The stock surged after breaking above its recent consolidation range and moving beyond the ₹120.00 zone.
Is KAKATCEM trading above its 21-day SMA?
Yes. The stock is trading above its 21-day SMA of ₹101.03.
What are the next important levels for KAKATCEM?
Support is placed at ₹125.00–115.00, while resistance is seen near ₹155.00–168.00.