
Highlights
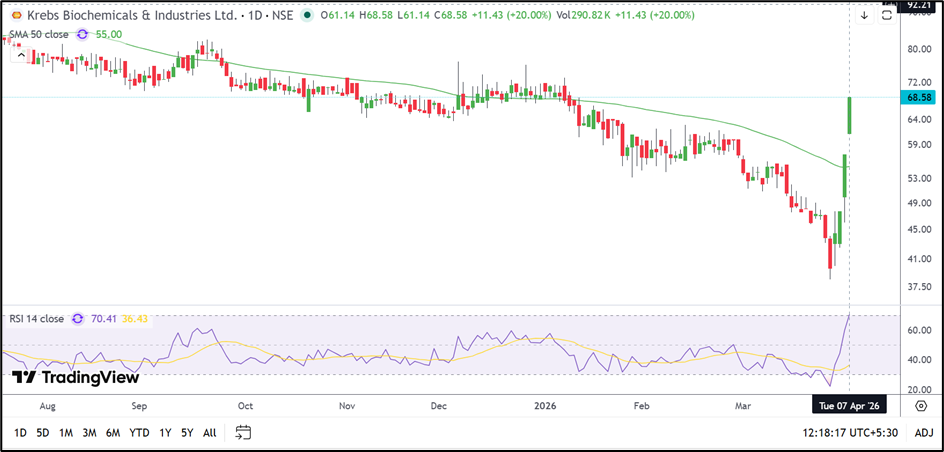
- Krebs Biochemicals (NSE: KREBSBIO) surged 20.00% to INR 68.58.
- The stock moved sharply above its 50-day SMA near INR 55.00.
- December 2025 quarter net loss stood at INR 312.65 lakh.
Krebs Biochemicals (NSE: KREBSBIO) witnessed a sharp rally on 7 April 2026, with the stock hitting a 20.00% upper circuit at INR 68.58. The share opened at INR 61.14 and continued to move higher through the session without any major pullback. The day’s high and close remained at INR 68.58, while the session low was INR 61.14. VWAP stood at INR 66.62.
The latest move has significantly improved the near-term technical structure after the stock spent several weeks trading under pressure. Krebs Biochemicals (NSE: KREBSBIO) has now moved decisively above its 50-day Simple Moving Average near INR 55.00, indicating that buyers have regained control in the short term.
Fundamental View
For the quarter ended 31 December 2025, Krebs Biochemicals (NSE: KREBSBIO) reported standalone total income of INR 727.85 lakh. The company posted a loss before tax of INR 312.65 lakh, while net loss also stood at INR 312.65 lakh. Earnings per share for the quarter was negative INR 1.45.
The latest quarterly numbers show that the company continues to remain loss-making. Krebs Biochemicals (NSE: KREBSBIO) has reported losses over the last eight quarters, which means that the recent rally is being driven more by technical momentum than by a visible improvement in fundamentals.
Technical View
Krebs Biochemicals (NSE: KREBSBIO) is currently trading near INR 68.58 after a strong breakout above the INR 61.00 zone. The stock has also moved comfortably above its 50-day Simple Moving Average of INR 55.00.
The latest session formed a large bullish candle with strong momentum. The sharp rise after a prolonged decline suggests that short covering and fresh buying have both contributed to the move.
The 14-day RSI has jumped to around 70.41 and is now well above its signal line near 36.43. This indicates that momentum has turned strongly positive, although the stock is now entering overbought territory.
As long as Krebs Biochemicals (NSE: KREBSBIO) remains above INR 61.00, the current rebound may continue. However, after such a sharp rally in a single session, the stock may also witness volatility or profit booking near higher levels.
Key Technical Levels
Immediate support is placed near INR 61.00. If the stock falls below this level, the next important support zone is around INR 55.00.
On the upside, the first resistance is seen near INR 77.00. A stronger hurdle remains around INR 85.00.
Source: TradingView
Risks To Watch
- The stock has entered overbought territory after the sharp rally.
- Resistance near INR 77.00–85.00 may trigger profit booking.
- The company continues to remain loss-making.
- Volatility may stay elevated due to the strong one-day move.
FAQs
- Why did Krebs Biochemicals (NSE: KREBSBIO) hit an upper circuit today?
The stock rallied sharply after breaking above the INR 61.00 level and attracting strong buying interest. - What was Krebs Biochemicals’ December 2025 net result?
The company reported a standalone net loss of INR 312.65 lakh. - What are the important support and resistance levels?
Support is placed near INR 61.00–55.00, while resistance remains near INR 77.00–85.00.