
Highlights
- Mallcom (India) Ltd stock declined over 2% in the latest NSE session.
- RSI remained below 40, indicating weak momentum without clear reversal signals.
- Price trades well below 51-period SMA, reinforcing ongoing bearish trend structure.
Shares of Mallcom (India) Ltd (NSE:MALLCOM) were trading at ₹1,007.50 on March 27, 2026, marking a decline of 2.18% on the National Stock Exchange of India. The stock has maintained a consistent downtrend since late October 2025, forming a pattern of lower highs and failed recovery attempts.
The price remains significantly below its 51-period Simple Moving Average (SMA) at ₹1,109.01, which continues to act as a strong resistance barrier. The most recent rejection near this level in late February reinforces the prevailing bearish structure. The stock is currently hovering near the psychological ₹1,000 support level, which may act as a near-term pivot zone.
Momentum and Volume Indicators
The Relative Strength Index (RSI 14) stands at 36.21, with its signal line at 37.58. The RSI is trending downward, indicating weakening momentum. It remains in a neutral-to-bearish range, suggesting neither oversold conditions nor strong recovery signals.
Trading volume is relatively low at 2.06K, reflecting limited market participation. The current price decline appears gradual rather than aggressive, indicating a lack of buying interest rather than heavy selling pressure. However, the absence of demand also limits the possibility of a near-term rebound.
Key Technical Levels
At ₹1,007.50, the stock is trading within a well-defined range, with immediate support at ₹906.75 and stronger support at ₹856.38, which may act as key demand zones on declines. On the upside, resistance levels at ₹1,108.25 and ₹1,158.63 could cap near-term advances.
The overall technical structure suggests consolidation, with price likely to remain range-bound unless a decisive breakout above ₹1,108.25 or breakdown below ₹906.75 occurs.
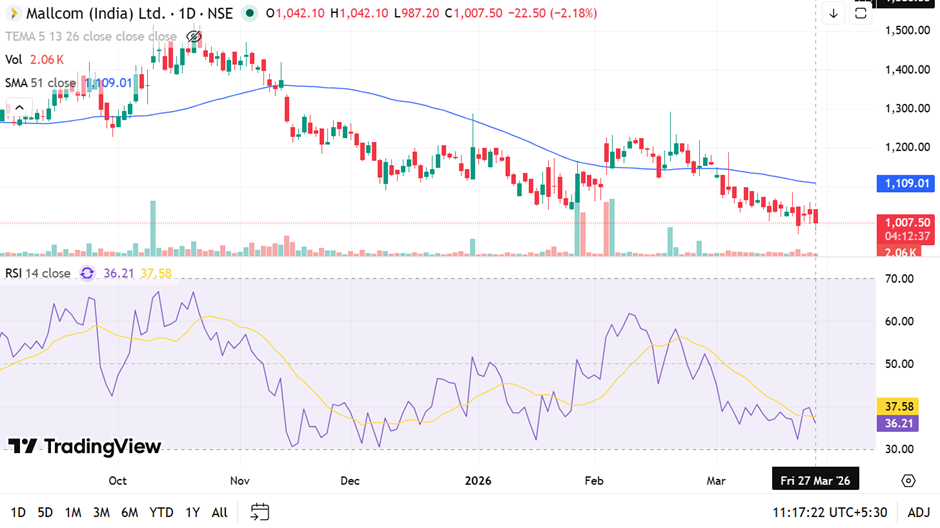
Source: TradingView
Key Risks
- Continued rejection below SMA may extend bearish trend.
- Weak RSI momentum may allow further downside movement.
- Low volume indicates absence of buying support.
- Break below ₹1,000 may accelerate selling pressure.
Summary
Mallcom (India) stock declined over 2% and remains in a sustained downtrend. The price is trading well below its 51-period SMA, which continues to act as resistance. RSI indicates weak momentum, while low volume reflects limited participation. The ₹1,000 level remains a key support zone, and its behavior will likely determine near-term direction.
FAQs
- Why is Mallcom (India) stock under pressure?
The stock is in a downtrend with repeated failures near resistance and continued formation of lower highs since late 2025. - What does the RSI indicate for Mallcom stock?
RSI near 36 suggests weak momentum, indicating neither oversold conditions nor signs of immediate recovery. - What are the key levels to watch for Mallcom stock?
Resistance levels are ₹1,108.25 and ₹1,158.63, while support levels are ₹906.75 and ₹856.38.