
Highlights
- MANALIPETC shares surged more than 11% to enter the NSE top gainers list.
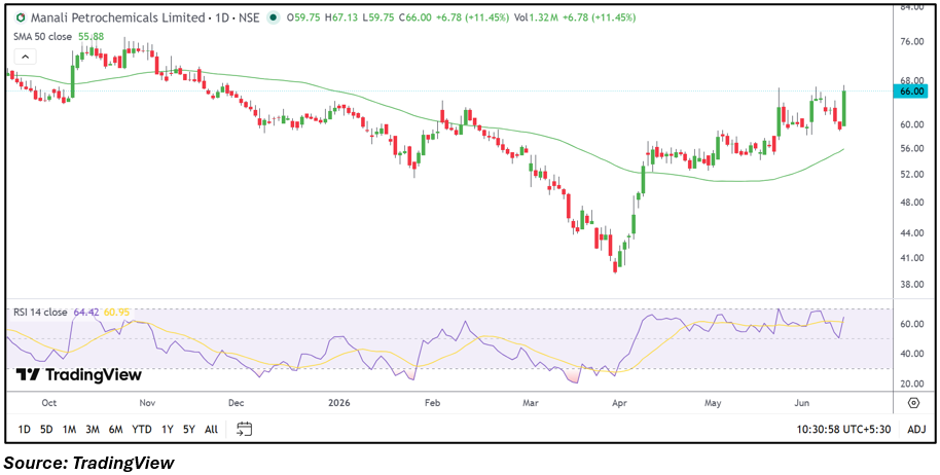
- The stock rallied well above its 50-day SMA, reflecting improving momentum.
- Strong quarterly profitability remains a key factor supporting investor interest.
Overview
Manali Petrochemicals Limited (NSE: MANALIPETC) attracted strong market attention on June 12 after its shares climbed 11.33% to ₹65.93. The stock emerged among the top gainers on the NSE, supported by robust price action and increased trading activity.
The rally pushed the stock close to its recent highs, with buyers driving the price from an opening level of ₹59.75 to an intraday high of ₹67.13. The move highlights renewed investor interest in the specialty chemicals and petrochemicals player.
Fundamental View
For the quarter ended March 2026, Manali Petrochemicals reported standalone total income of ₹25,671.34 lakh. Profit before tax stood at ₹3,273.53 lakh, while net profit came in at ₹2,701.00 lakh.
The company reported earnings per share of ₹1.57 for the quarter. The latest results indicate continued profitability, which may be supporting the positive sentiment seen in the stock.
Technical View
MANALIPETC is trading at ₹65.93, up 11.33% for the session. The stock is trading comfortably above its 50-day SMA of ₹55.88, indicating an improvement in the broader trend structure.
Price action reflects a strong breakout from the recent consolidation zone, with the stock reclaiming levels not seen in several months. The sharp upward move has helped the stock outperform the broader market during the session.
Momentum Indicator
The RSI is around 64.42 and remains above its signal line, indicating improving momentum conditions. While momentum has strengthened considerably, the indicator remains below extreme overbought territory, suggesting traders will monitor whether the current move can sustain further upside.
Key Technical Levels
MANALIPETC is trading well above its 50-day SMA of ₹55.88, which now serves as an important reference point for the ongoing trend. The stock has tested an intraday high of ₹67.13 during the current rally. Sustained trading above the recent breakout region may help maintain positive momentum, while a move back toward the 50-day SMA could indicate consolidation following the sharp advance.
Risks to Watch
- Raw material price fluctuations may impact margins.
- Chemical sector demand can remain cyclical.
- Profit-booking may emerge after a sharp rally.
- Commodity-linked volatility may affect earnings visibility.
Summary
Manali Petrochemicals has entered the NSE top gainers list after rallying more than 11% in a single session. Strong quarterly profitability, a breakout above the 50-day SMA, and improving momentum indicators have contributed to the stock's recent strength. Investors are likely to monitor whether MANALIPETC can sustain its move near recent highs while maintaining earnings performance.
FAQs
Why did MANALIPETC shares rise today?
The stock gained sharply due to strong momentum, increased trading activity, and investor focus on its profitable quarterly performance.
How did Manali Petrochemicals perform in the latest quarter?
The company reported net profit of ₹2,701.00 lakh and earnings per share of ₹1.57 for the March 2026 quarter.
What is the key technical level to watch?
The 50-day SMA near ₹55.88 remains an important trend reference for the stock.