
Highlights
- Mangalam Global Enterprise Ltd surged 13.58% to ₹14.64 after touching an intraday high of ₹15.43.
- The stock has moved well above its 21-day SMA of ₹11.76, improving the near-term trend.
- Support is placed at ₹13.50–₹12.75, while resistance is seen near ₹16.00–₹17.80.
Overview
Mangalam Global Enterprise Ltd (NSE: MGEL) rose 13.58% to ₹14.64 after opening at ₹14.28. The stock hit an intraday high of ₹15.43 and remained among the top gainers in the session.
The rally extends the sharp recovery from the March low near ₹9.50. After spending several weeks in a narrow range, MGEL has now broken above recent consolidation levels and entered a stronger short-term structure.
Fundamental View
For the quarter ended December 2025, Mangalam Global Enterprise reported consolidated total income of ₹76,171.84 lakh.
Profit before tax stood at ₹982.40 lakh, while net profit came in at ₹851.12 lakh. Earnings per share was ₹0.26.
The latest quarterly numbers show that the company remains profitable despite the earlier weakness in the share price. That has provided some support to the recent rebound.
Technical View
MGEL is now trading comfortably above its 21-day SMA of ₹11.76. The stock has also formed a sequence of higher lows over the past few weeks, suggesting that the recovery is gradually becoming more stable.
The latest move above ₹14.00 indicates that buyers have regained control after the long decline seen through late 2025 and early 2026. However, the pace of the rise has also pushed the 14-day RSI to 72.67.
An RSI above 70.00 usually indicates that the stock is entering an overheated zone. This means MGEL may witness short-term consolidation or a temporary pullback before the next move higher.
Key Technical Levels
The ₹365.00–345.00 area may now act as the first support region if the stock witnesses’ profit-booking after the recent rally.
On the upside, the next resistance zone is placed near ₹440.00–480.00. A move above ₹480.00 may strengthen the current uptrend further.
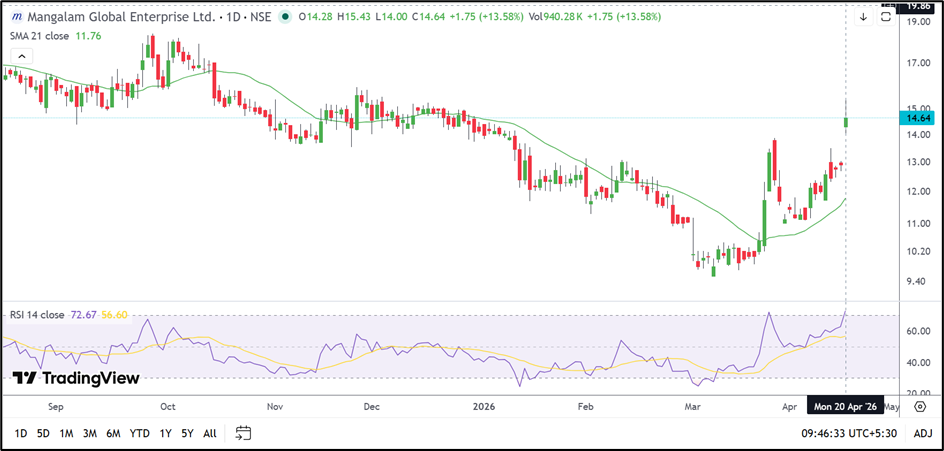
Source: TradingView
Risks to Watch
- RSI above 70.00 could increase near-term volatility.
- Failure to hold above ₹13.50 may weaken the recovery.
- A sharp move toward ₹16.00 may attract profit booking.
- The stock is still below its late-2025 highs.
Summary
Mangalam Global Enterprise Ltd has staged a strong rebound and improved its short-term technical picture. The stock remains in a positive structure while trading above ₹13.50, but the sharp rally has also made momentum look stretched. A sustained move above ₹16.00 may open the way toward ₹17.80.
FAQs
Why is Mangalam Global Enterprise share price rising today?
The stock gained after breaking above its recent trading range and extending its rebound from March lows.
What is the support zone for MGEL?
The key support zone is placed between ₹13.50 and ₹12.75.
What is the next resistance level for MGEL?
The next resistance zone is placed near ₹16.00–₹17.80.