
Highlights
- Manugraph India Limited stock fell over 2% in the latest NSE session.
- RSI dropped below 25, entering oversold territory with continued weak momentum.
- Price remains well below 51-period SMA, reinforcing ongoing bearish trend structure.
Shares of Manugraph India (NSE:MANUGRAPH) were trading at ₹11.11 on March 27, 2026, declining 2.71% on the National Stock Exchange of India. The stock has been in a sustained downtrend since late 2025, consistently forming lower highs and lower lows.
The price is currently trading significantly below its 51-period Simple Moving Average (SMA) at ₹14.50, which continues to act as a strong resistance level. Multiple recovery attempts during February and March have failed near this level, reinforcing the bearish structure.
Momentum and Volume Indicators
The Relative Strength Index (RSI 14) has declined to 24.12, placing it firmly in oversold territory. While such levels may sometimes precede a short-term technical bounce, the current momentum does not show signs of stabilization or bullish divergence.
Volume remains subdued at approximately 5.86K, indicating weak participation. The presence of small red candles suggests that while selling pressure is not aggressive, there is a notable absence of buying interest at current levels.
Key Technical Levels
The stock is trading at ₹11.11within a defined range, with immediate support at ₹10.00 and stronger support at ₹9.44, which may act as demand zones during declines. On the upside, resistance levels at ₹12.22 and ₹12.78 could limit short-term rallies.
The overall setup suggests consolidation, with price likely to remain range-bound unless a decisive breakout above ₹12.22 or breakdown below ₹10.00 occurs.
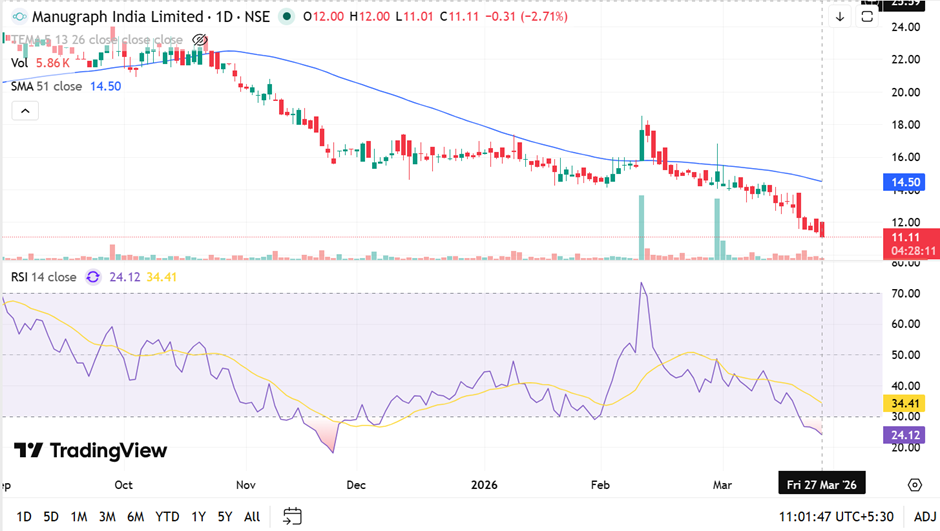
Source: TradingView
Key Risks
- Persistent trading below SMA may extend bearish trend.
- Oversold RSI may not immediately result in price recovery.
- Weak volume indicates lack of buying support.
- Break below ₹10 level could trigger further downside.
Summary
Manugraph India stock declined over 2% in the latest session, continuing its broader downtrend. The stock remains well below its 51-period SMA, reinforcing resistance in the medium term. RSI has entered oversold territory, but momentum remains weak without signs of reversal. Support near ₹10 and resistance near ₹12.22 will be key levels to watch.
FAQs
- Why is Manugraph India stock in a downtrend?
The stock has been forming consistent lower highs and lower lows, indicating sustained selling pressure since late 2025. - Does the oversold RSI indicate a reversal?
RSI below 25 suggests oversold conditions, but no confirmation of reversal is visible without bullish divergence or volume support. - What are the key levels to watch for Manugraph India stock?
Resistance levels are ₹12.22 and ₹12.78, while support levels are ₹10.00 and ₹9.44.