
Highlights
- Motisons Jewellers declined more than 10% after a sharp rally in recent sessions.
- The stock witnessed heavy volatility after touching an intraday high of ₹16.34.
- Technical indicators suggest traders are closely watching key support zones.
Motisons Jewellers Witnesses Sharp Correction
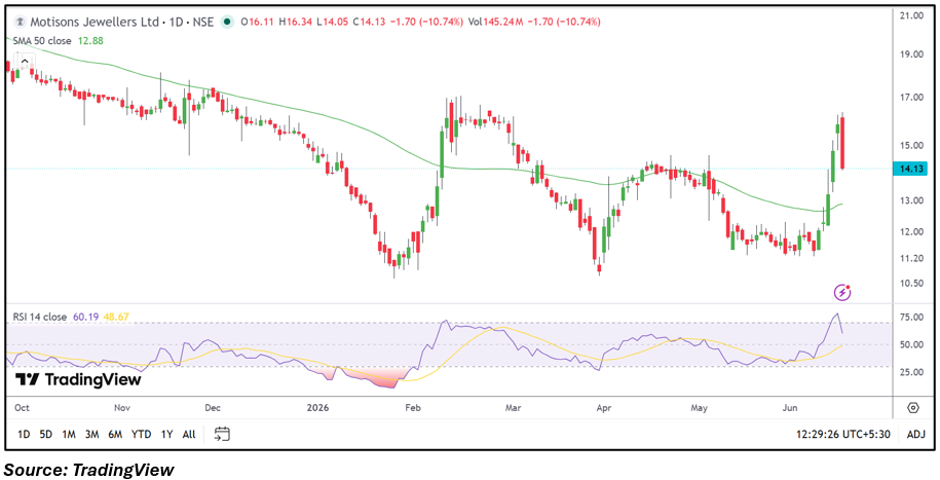
Shares of Motisons Jewellers Ltd. (NSE: MOTISONS) came under significant selling pressure on June 16, 2026, falling 10.68% to ₹14.14. The stock opened at ₹16.11 and climbed to an intraday high of ₹16.34 before witnessing aggressive profit booking. It later slipped to a low of ₹14.05, highlighting the elevated volatility in the counter.
The decline follows a strong rally in recent sessions, making the latest move appear more like a sharp correction after a rapid upward surge. Trading volumes remained elevated at 145.24 million shares, indicating active participation from both buyers and sellers.
Recent Financial Performance Remains Positive
For the quarter ended March 2026, Motisons Jewellers reported total income of ₹14,323.07 lakh. The company posted a profit before tax of ₹1,138.25 lakh and a net profit of ₹830.19 lakh. Earnings per share stood at ₹0.08 during the quarter. The profitability reported in the latest quarter provides a supportive fundamental backdrop even as the stock experiences near-term price volatility.
Technical Picture Shows Increased Volatility
From a technical perspective, the stock remains above its 50-day Simple Moving Average (SMA), which is positioned around ₹12.88. This indicates that the broader intermediate trend remains constructive despite today's steep decline.
However, the formation of a long red candle after a recent spike suggests that traders booked profits aggressively near higher levels. The Relative Strength Index (RSI) stands near 60, cooling from recent elevated readings but remaining above the neutral 50 mark. This indicates that momentum has weakened but has not completely disappeared.
The stock also failed to sustain gains above ₹16.00, which may now act as an immediate resistance area in the near term.
Key Technical Levels to Watch
Following today's sharp decline, immediate support is visible around ₹14.00, which coincides with the day's low. If selling pressure continues, the next support zone could emerge near ₹13.00, close to the 50-day moving average region. On the upside, resistance is likely around ₹16.34, the recent intraday high, while a move above this level could open the door toward the ₹17.00–₹18.00 zone where previous selling pressure emerged.
What Could Drive the Next Move?
The next direction for Motisons Jewellers may depend on whether buyers defend the ₹14.00 region. A sustained hold above support could indicate that the recent decline was primarily profit booking after the rally. However, continued weakness and a break below key support zones may encourage further short-term selling activity.
Given the sharp price swings witnessed over the last few sessions, traders are likely to monitor volume trends and price behavior around support levels before establishing fresh positions.
Risks to Watch
- Sharp volatility following recent price spikes.
- Profit-booking pressure after rapid rallies.
- Liquidity fluctuations in high-volume sessions.
- Failure to hold above the 50-day moving average.
Summary
Motisons Jewellers shares fell more than 10% on June 16 after a strong recent rally, indicating aggressive profit booking at higher levels. While the stock remains above its 50-day SMA and the company reported a profitable March 2026 quarter, technical indicators suggest heightened volatility. Traders are now watching the ₹14.00 support zone and ₹16.34 resistance level to determine the stock's next directional move.
Frequently Asked Questions
- Why did Motisons Jewellers stock fall over 10% today?
The decline followed a strong rally, with traders booking profits after the stock reached higher price levels.
- Is Motisons Jewellers still above its key moving average?
Yes, the stock continues to trade above its 50-day SMA, indicating broader trend support.
- What levels should traders monitor now?
Support is visible near ₹14.00, while resistance is located around ₹16.34 and higher zones.