
Highlights
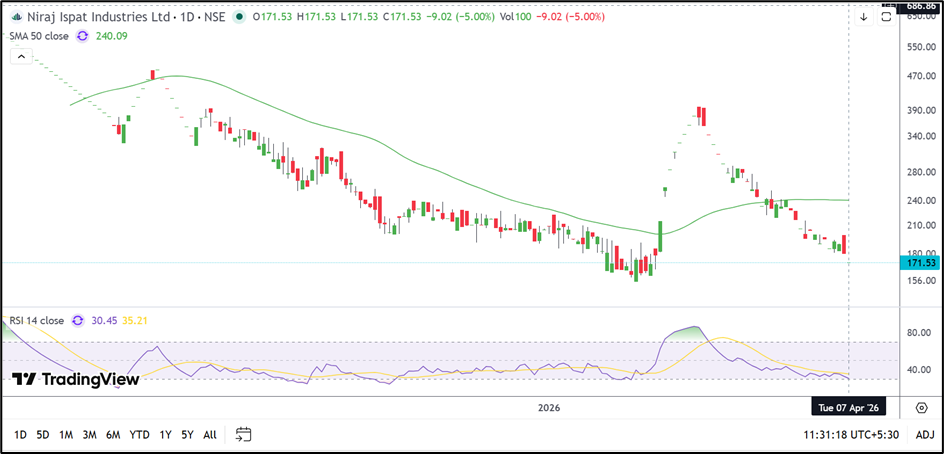
- Niraj Ispat Industries (NSE: NIRAJISPAT) fell 5.00% to INR 171.53.
- The stock remains well below its 50-day SMA near INR 240.09.
- December 2025 quarter net profit stood at INR 39.89 lakh.
Niraj Ispat Industries (NSE: NIRAJISPAT) came under heavy selling pressure on 7 April 2026, with the stock declining 5.00% to INR 171.53. The share opened at INR 171.53 and remained locked at the same level throughout the session, with the day’s high and low also at INR 171.53. VWAP stood at INR 171.53.
The latest fall has pushed the stock closer to its recent lows after a failed recovery attempt in March. Niraj Ispat Industries (NSE: NIRAJISPAT) is now trading significantly below its 50-day Simple Moving Average near INR 240.09, indicating that the broader structure remains weak.
Fundamental View
For the quarter ended 31 December 2025, Niraj Ispat Industries (NSE: NIRAJISPAT) reported standalone total income of INR 116.18 lakh. Profit before tax came in at INR 53.29 lakh, while net profit stood at INR 39.89 lakh. Earnings per share for the quarter was INR 6.65.
The quarterly numbers show that the company remained profitable despite the sharp fall in the share price. However, the stock continues to face pressure due to weak sentiment and limited liquidity.
Technical View
Niraj Ispat Industries (NSE: NIRAJISPAT) is currently trading near INR 171.53 and remains far below its 50-day Simple Moving Average of INR 240.09. The chart shows that the stock has continued to make lower highs and lower lows after failing to hold above the INR 200.00 zone.
The latest lower circuit indicates that sellers remain firmly in control. The recent bounce attempt from the INR 160 region also failed to sustain, suggesting that the stock is still facing strong resistance at higher levels.
The 14-day RSI is near 30.45, below its signal line around 35.21. This indicates that momentum remains weak and the stock is approaching oversold territory. While a short-term rebound cannot be ruled out, the overall trend remains negative unless the stock moves back above INR 185.00.
Niraj Ispat Industries (NSE: NIRAJISPAT) is also facing resistance from its declining moving average, which may continue to cap any recovery.
Key Technical Levels
Immediate support is placed near INR 160.00. If this level breaks, the next downside zone is seen around INR 150.00.
On the upside, the first important resistance is near INR 185.00. A stronger hurdle is placed around INR 200.00.
Source: TradingView
Risks To Watch
- A break below INR 160.00 may trigger further downside.
- Resistance near INR 185.00–200.00 could limit any rebound.
- The stock remains significantly below its 50-day moving average.
- Low liquidity may result in sharp and volatile price movements.
Summary
Niraj Ispat Industries (NSE: NIRAJISPAT) remains in a weak technical position after hitting a 5% lower circuit at INR 171.53. The stock is trading far below its 50-day moving average and continues to face resistance at higher levels. Support is placed near INR 160.00–150.00, while resistance is seen at INR 185.00–200.00.
FAQs
- Why did Niraj Ispat Industries (NSE: NIRAJISPAT) hit a lower circuit today?
The stock remained under heavy selling pressure and failed to hold above recent support levels. - What was Niraj Ispat Industries’ December 2025 net profit?
The company reported standalone net profit of INR 39.89 lakh. - What are the important support and resistance levels?
Support is placed near INR 160.00–150.00, while resistance remains near INR 185.00–200.00.