
Highlights
- Noida Toll Bridge shares hit the 20% upper circuit during Wednesday’s trade.
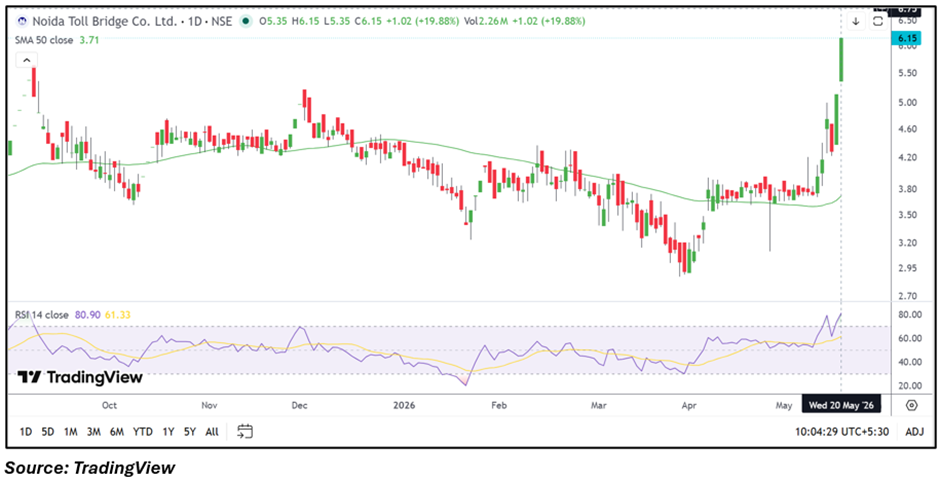
- The stock moved sharply above its 50-day SMA with RSI momentum strengthening.
- Q4 consolidated net profit stood at INR 384.81 million amid elevated volumes.
Overview
Noida Toll Bridge Company Limited (NSE: NOIDATOLL) shares surged 19.88% to INR 6.15 on May 20, 2026, placing the stock among the top gainers on the NSE. The stock opened at INR 5.35 and touched an intraday high of INR 6.15 during the session.
The company reported consolidated total income of INR 1,271.71 million for the quarter ended March 2026. Profit before tax stood at INR 382.98 million, while net profit came at INR 384.81 million. Earnings per share for the quarter was reported at INR 0.21.
Fundamental View
Noida Toll Bridge Company operates infrastructure-related assets and remains linked to traffic flow trends, urban infrastructure activity, and operational performance.
The latest quarterly earnings update coincided with a sharp increase in trading volumes and price momentum in the stock. Market participants are likely to monitor sustainability in earnings performance and movement in infrastructure-related counters going forward.
Technical View
Noida Toll Bridge is currently trading well above its 50-day SMA near INR 3.71, reflecting a significantly improved near-term structure after prolonged consolidation around lower levels. The sharp rally has pushed the stock toward fresh multi-month highs while indicating strong momentum expansion in the short term.
The 14-day RSI climbed near 80.90 and remained above its signal line, indicating elevated momentum conditions after the recent breakout move. The momentum oscillator also turned sharply higher, reflecting increased price strength and heightened trading activity during the session. However, the sharp rise in RSI also indicates stretched short-term momentum conditions that may keep volatility elevated.
Key Technical Levels
Noida Toll Bridge has immediate support placed near INR 5.50, while the stronger support zone is seen around INR 4.90. On the upside, the stock may face immediate resistance near INR 6.60, followed by the INR 7.20 zone, which could remain important for further upside continuation in the near term.
Key Risks
- Elevated volatility may continue after the sharp upper circuit move.
- Lower traffic or infrastructure activity could affect earnings visibility.
- ASM surveillance measures may increase trading restrictions.
- Sharp momentum spikes may trigger profit-booking pressure.
Summary
Noida Toll Bridge (NSE: NOIDATOLL) witnessed a sharp rally after its recent quarterly earnings update, with the stock hitting the 20% upper circuit during Wednesday’s trade. The stock has moved decisively above its 50-day SMA while RSI and momentum oscillators also strengthened notably. Traders may now monitor whether the stock sustains above the INR 5.50 zone, while resistance around INR 6.60–7.20 could remain important in the near term.
FAQs
- Why did Noida Toll Bridge shares surge today?
The stock rallied sharply after increased trading activity and positive momentum following the company’s quarterly earnings update. - What is the support zone for NOIDATOLL stock?
Immediate support is placed near INR 5.50, while stronger support is seen around INR 4.90. - What resistance levels should traders watch in Noida Toll Bridge?
The stock may face near-term resistance around INR 6.60 and the INR 7.20 zone.