
Highlights
- Ola Electric Mobility Limited shares declined 6.14% to ₹38.37 on April 13, 2026.
- The stock faced pressure after a steep rally from March lows and failed to move past a near-term hurdle.
- Weak quarterly earnings and an overheated RSI added to the pullback.
Overview
Ola Electric Mobility Limited (NSE: OLAELEC) slipped 6.14% to ₹38.37 on April 13, 2026, after opening at ₹39.79 and touching an intraday low of ₹37.96. The decline came after the stock had rallied strongly over the previous few sessions.
The stock had nearly doubled from its March low near ₹24.00 and had moved well above its 50-day Simple Moving Average near ₹27.75. However, the latest session suggests that the sharp rebound is now facing pressure as the stock approaches a key near-term hurdle.
Fundamental View
Ola Electric Mobility continues to remain under pressure on the earnings front. For the December 2025 quarter, the company reported total income of ₹50,400.00 lakh.
However, the company posted a loss before tax of ₹48,700.00 lakh, while net loss also stood at ₹48,700.00 lakh. Earnings per share remained negative at ₹1.10, highlighting that the recent rise in the stock price has not yet been supported by an improvement in profitability.
Technical View
After a sharp rally over the last few weeks, Ola Electric appears to be facing resistance near the ₹41.00–45.00 region. The latest session formed a red candle immediately after the stock touched a fresh short-term high, indicating that some traders may be locking in gains after the steep rise.
The stock is still trading comfortably above its 50-day Simple Moving Average near ₹27.75, which suggests that the broader recovery trend remains intact for now. However, the pace of the rally has slowed, and the stock may enter a phase of consolidation after the recent vertical move.
The 14-day RSI has risen to 72.12, moving into the overheated zone. This suggests that momentum remains strong, but it also raises the possibility of sharper swings or a temporary cooling phase in the near term.
Key Technical Levels
The stock may find near-term support around ₹34.00–32.00 if the current pullback extends. On the upside, the ₹41.00–45.00 region remains the key area to watch, as the stock has started facing pressure after approaching this zone following the recent rally.
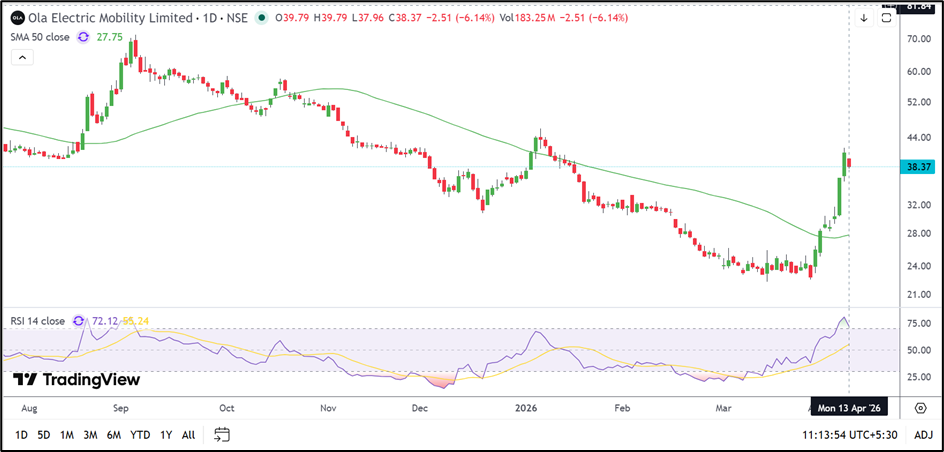
Source: TradingView
Risk to Watch
- The stock has rallied sharply in a short period and may remain volatile.
- Continued losses may limit confidence in the current rebound.
- Failure to hold above ₹34.00 could deepen the recent pullback.
- The RSI is in the overheated zone, which may lead to short-term cooling.
Summary
Ola Electric Mobility has witnessed a strong rebound from its March lows, but the latest session suggests that the rally may be slowing near a key overhead zone. The stock remains above its 50-day SMA, although persistent losses and an overheated RSI indicate that volatility could remain elevated.
FAQs
Why did Ola Electric share price fall today?
The stock fell after a sharp rally in recent sessions and started facing pressure near the ₹41.00–45.00 region.
What is the 50-day SMA for Ola Electric?
The 50-day Simple Moving Average for Ola Electric is currently near ₹27.75.
How much loss did Ola Electric report in December 2025?
Ola Electric reported a consolidated net loss of ₹48,700.00 lakh in the December 2025 quarter.