
Highlights
- Prism Johnson Ltd (NSE: PRSMJOHNSN) jumped 14.18% to ₹143.00 after touching an intraday high of ₹143.44.
- The stock has moved decisively above its 21-day SMA of ₹125.69, improving the near-term trend.
- Support is placed at ₹130.00–₹118.00, while resistance is seen near ₹155.00–₹170.00.
Overview
Prism Johnson Ltd (NSE: PRSMJOHNSN) surged 14.18% to ₹143.00 on 20-Apr-2026 after opening at ₹126.30. The stock touched an intraday high of ₹143.44 and emerged among the top gainers in the session.
The sharp rise comes after several weeks of sideways movement near the ₹124.00–₹128.00 zone. The latest breakout has pushed the stock to its highest level in nearly four months and suggests that the earlier period of consolidation may have ended.
Fundamental View
For the quarter ended December 2025, Prism Johnson reported standalone total income of ₹1,74,233.00 lakh.
Profit before tax stood at ₹10,316.00 lakh, while net profit came in at ₹7,725.00 lakh. Earnings per share was ₹1.53.
The company remains profitable and the latest quarterly numbers indicate stable operating performance. The positive earnings profile has added support to the recent improvement in the share price.
Technical View
Prism Johnson is now trading well above its 21-day SMA of ₹125.69, indicating that the short-term trend has turned positive. The breakout above the earlier consolidation band near ₹128.00–₹130.00 has improved the overall chart structure.
The latest candle also reflects strong upward momentum, as prices moved sharply higher in a single session after remaining range-bound for several weeks. This kind of move often indicates that the stock is attempting to shift into a higher trading zone.
However, the 14-day RSI has climbed to 77.73, which places the stock in a stretched momentum zone. While this reflects strong upward strength, it also increases the possibility of short-term consolidation or profit booking after the recent surge.
Key Technical Levels
The ₹130.00–₹118.00 zone may now act as the first support area if the stock witnesses some profit booking after the recent surge. On the upside, the next resistance band is placed near ₹155.00–₹170.00. Prism Johnson continues to trade above its 21-day SMA of ₹125.69, while the 14-day RSI at 77.73 indicates that momentum remains elevated.
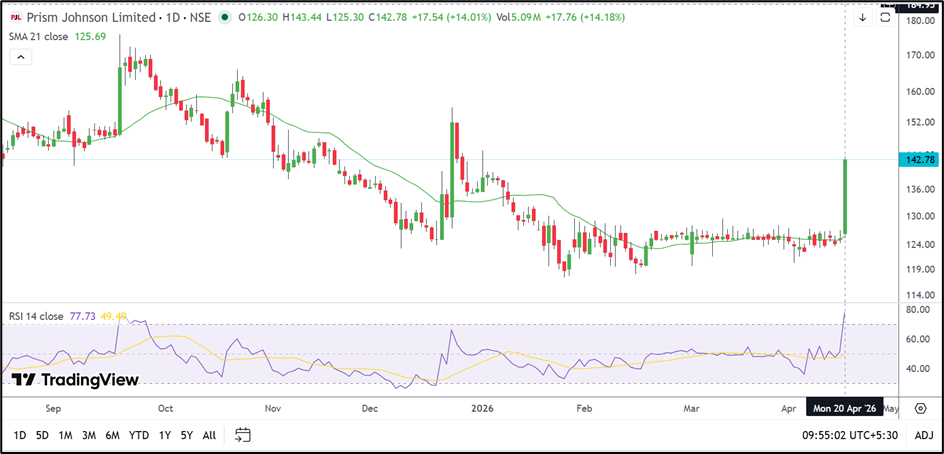
Source: TradingView
Risks to Watch
- RSI above 75.00 suggests that the stock may be overheated in the near term.
- Failure to hold above ₹130.00 may weaken the breakout structure.
- A quick move toward ₹155.00 could invite profit booking.
- The stock has risen sharply in a short period, increasing near-term volatility.
Summary
Prism Johnson Ltd has broken out of a long trading range and improved its short-term structure after a strong rally. The stock remains technically positive while trading above ₹130.00, though the elevated RSI suggests that some consolidation may occur after the recent move. A sustained rise above ₹155.00 may open the way toward ₹170.00.
FAQs
Why is Prism Johnson share price rising today?
The stock gained after breaking above its recent consolidation zone and extending its short-term rebound.
What is the key support zone for Prism Johnson?
The immediate support area is placed between ₹130.00 and ₹118.00.
What are the next resistance levels for Prism Johnson shares?
The next upside zone is seen near ₹155.00–₹170.00.