
Highlights
- Quick Heal Technologies shares jumped over 10% despite reporting a quarterly loss.
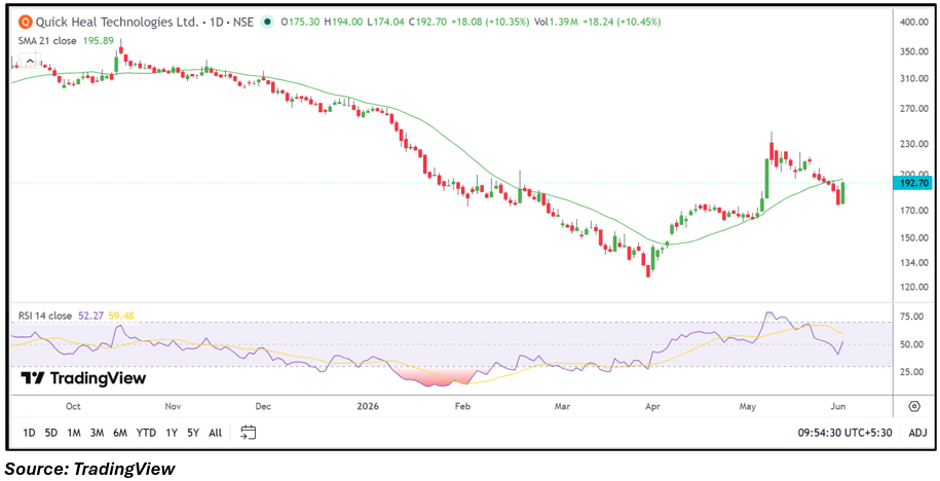
- The stock reclaimed its 21-day SMA, improving the near-term technical structure.
- RSI recovered above 50, indicating momentum stabilization after recent weakness.
Overview
Quick Heal Technologies (NSE: QUICKHEAL) gained more than 10% on June 2, with the stock rising to INR 192.70. The rally came despite the company reporting losses in its latest quarterly results, suggesting that market participants focused on the stock's recovery from recent lows and improving technical setup. The move also pushed the stock closer to important resistance levels after several weeks of volatile trading.
Fundamental View
For the quarter ended March 2026, Quick Heal Technologies reported standalone total income of INR 5,247.00 lakh. The company posted a loss before tax of INR 2,964.00 lakh and a net loss of INR 1,991.00 lakh. Earnings per share (EPS) stood at negative INR 3.58.
While the quarterly numbers reflected operational challenges, the stock's recent recovery suggests investors may be focusing on future business prospects rather than the latest earnings performance alone. However, continued profitability remains an important factor to monitor.
Technical View
Quick Heal Technologies traded at INR 192.70, gaining 10.35% during the session. The stock moved back above its 21-day SMA of INR 195.89 on an intraday basis and approached that key moving-average zone, reflecting an improvement in the near-term technical structure. Recent price action indicates a rebound from the support region formed near the end of May.
The 14-day RSI stood at 52.27, recovering above the neutral 50 mark and indicating stabilization in momentum conditions. The latest move suggests the stock is attempting to rebuild strength after a prolonged correction from earlier highs.
Momentum Indicator
RSI at 52.27 reflects neutral-to-positive momentum. The indicator has recovered from lower levels and points to improving sentiment, though it remains well below overbought territory.
Key Technical Levels
Based on the current price of INR 192.70, immediate support is placed near INR 183.07, which is approximately 5% below the current market price. A stronger support zone is located near INR 173.43, representing around 10% downside from current levels.
On the upside, the first resistance level is positioned near INR 202.34, roughly 5% above the current price. If momentum continues, the next resistance zone could emerge near INR 211.97, representing approximately 10% upside from current levels.
Risks to Watch
- Continued losses could weigh on long-term investor sentiment.
- Intense competition in cybersecurity software markets.
- Volatile price swings may trigger profit booking.
- Failure to sustain above recent breakout levels may weaken momentum.
Summary
Quick Heal Technologies shares rallied sharply despite reporting quarterly losses, indicating that traders focused on the stock's improving technical setup rather than near-term earnings weakness. The recovery in RSI and the move toward key moving-average levels have improved the near-term outlook. However, investors may continue monitoring profitability trends and the stock's ability to maintain momentum above important support zones.
FAQs
- Why did Quick Heal Technologies shares rise despite losses?
The market appeared to focus on the stock's technical recovery and improving momentum rather than the latest quarterly loss.
- What is the key support level for QUICKHEAL?
Immediate support is near INR 183.07, while stronger support is located around INR 173.43.
- What does the RSI indicate for the stock?
An RSI of 52.27 suggests momentum has improved and currently remains in a neutral-to-positive range.