
Highlights
- Ramco Systems shares surged 19.99% after the company announced its latest Q4FY26 earnings.
- Consolidated net profit for the March quarter stood at INR 2,517.10 lakh.
- The stock climbed above its 50-day SMA while RSI entered the overbought region.
Overview
Ramco Systems Limited (NSE: RAMCOSYS) witnessed aggressive buying activity on May 22, 2026, with the stock locked at its 19.99% upper circuit near INR 469.90. The sharp rally followed the company’s latest quarterly earnings release, which drew market attention after improved profitability and earnings performance.
Trading activity also increased notably during the session, reflecting heightened investor participation after the Q4FY26 update.
Fundamental View
For the quarter ended March 2026, the company reported consolidated total income of INR 18,626.80 lakh. Profit before tax stood at INR 2,201.10 lakh, while net profit came in at INR 2,517.10 lakh. Earnings per share for the quarter were reported at INR 6.70.
The quarterly numbers improved market sentiment around the company, especially after volatile trading patterns witnessed in previous months.
Technical View
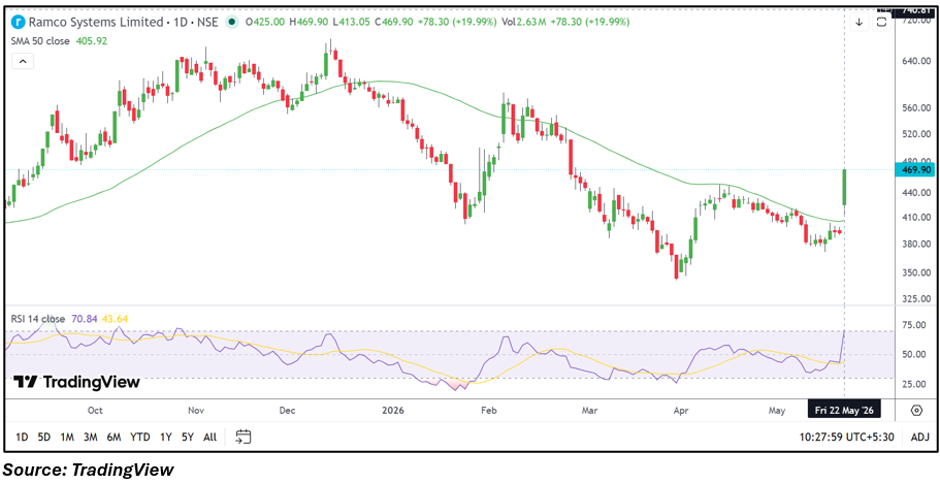
Ramco Systems stock is currently trading near INR 469.90, well above its 50-day SMA placed around INR 405.92, reflecting improving near-term price structure. Recent price action indicates a decisive upward breakout supported by expanded trading volumes.
The 14-day RSI has climbed near 70.84, suggesting strong momentum conditions while also placing the stock in the overbought zone in the short term. Continued movement above current levels may keep volatility elevated over the coming sessions.
Momentum Indicator
Momentum indicators strengthened sharply following the earnings-led rally. RSI crossed above the neutral zone and entered overbought territory, while the stock reclaimed levels above the 50-day moving average. The latest move also reflects renewed trader participation after a prolonged consolidation phase.
Key Technical Levels
Immediate support is placed near the INR 430.00-410.00 zone, which could act as an important short-term stability area during any corrective move. On the upside, resistance is expected around INR 490.00-515.00, where traders may watch for breakout continuation or profit-booking activity.
Risks to Watch
- RSI near overbought levels could trigger short-term volatility.
- Sharp rallies may attract profit-booking pressure at higher levels.
- Sustaining volume momentum remains important after the breakout.
- Broader weakness in IT stocks could affect market sentiment.
Summary
Ramco Systems shares surged nearly 20.00% after the company reported its latest quarterly earnings, with investors reacting positively to profitability and earnings growth. The stock moved decisively above its 50-day SMA, while momentum indicators strengthened sharply. Although near-term sentiment has improved, resistance near INR 490.00-515.00 and elevated volatility remain key factors to monitor.
FAQs
- Why did Ramco Systems shares rally sharply today?
The stock surged after the company reported improved quarterly profit and earnings performance. - What are the important support levels for Ramco Systems stock?
Immediate support is placed near the INR 430.00-410.00 zone. - What resistance levels should traders monitor now?
The next resistance area for the stock is near INR 490.00-515.00.