
Highlights
- The stock declined sharply and trades significantly below its 50-day moving average.
- RSI dropped to extremely oversold levels, indicating stretched downside momentum.
- Corporate actions including stock split and bonus issue remain subject to approvals.
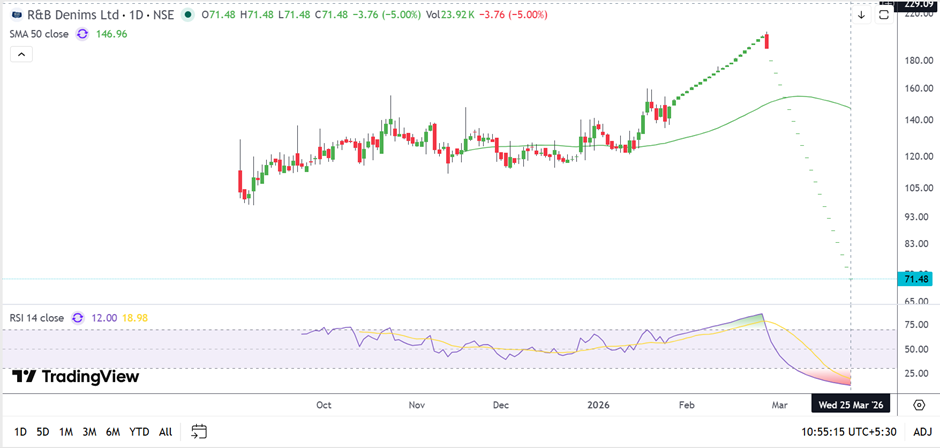
R&B Denims Ltd (NSE:RNBDENIMS) traded near INR 71.48 on March 25, 2026, declining around 5.00% during the session. The stock remains significantly below its 50-day Simple Moving Average near INR 146.96, indicating a weak broader technical structure.
The price action reflects a sharp vertical decline following a prior upward move, highlighting a sudden shift in market behaviour. This kind of movement often indicates increased volatility, with sellers dominating recent sessions. While occasional rebounds may occur, the prevailing trend continues to remain under pressure.
Momentum Indicators Signal Extreme Oversold Zone
The 14-day Relative Strength Index (RSI) is positioned near 12.00, indicating deeply oversold conditions. This suggests that the stock has experienced intense selling pressure over a short period.
Such low RSI levels may lead to short-term technical pullbacks; however, they also reflect a stretched downside environment. Any recovery would require sustained buying support and stabilisation in price action.
Key Support and Resistance Levels
R&B Denims Ltd is currently trading near ₹71.48 as of March 25, 2026, declining around 5.00%, and remains significantly below its 50-day Simple Moving Average near ₹146.96, indicating a weak broader setup. The price action reflects a sharp vertical decline following a prior upward move, highlighting a sudden shift in price behaviour.
The 14-day RSI near 12.00 indicates deeply oversold conditions, suggesting stretched momentum on the downside. In the near term, support is placed around ₹65.00–₹60.00, while resistance is seen near ₹85.00–₹100.00.
Source: TradingView
Financial and Corporate Developments
For the quarter ended December 31, 2025, the company reported total income of INR 7,020.16 lakh, compared to INR 6,924.04 lakh in the corresponding period. Profit after tax for the quarter stood at INR 528.28 lakh.
On a nine-month basis, total income was reported at INR 20,171.71 lakh, with profit after tax of INR 1,599.09 lakh.
During the period, the Board approved an increase in authorised share capital from INR 25.50 crore to INR 30.00 crore. It also approved a stock split from face value INR 2 to Re. 1 per share, subject to shareholder approvals.
Additionally, the company announced a bonus issue in the ratio of 1:2, meaning one bonus share for every two shares held, also subject to necessary approvals.
Key Risks
- Extreme volatility following sharp decline may continue in the near term.
- Deeply oversold RSI may not ensure sustained price recovery.
- Failure to hold support levels could lead to further downside.
- Corporate actions pending approvals may influence investor sentiment.
Summary
R&B Denims stock remains under significant pressure after a sharp decline, trading well below its 50-day moving average. RSI indicates extreme oversold conditions, reflecting strong selling momentum. While short-term rebounds are possible, the broader trend remains weak. Financial performance shows moderate growth, while corporate actions like stock split and bonus issue may influence future price movement.
FAQs
- What is the current trend of R&B Denims stock?
The stock is in a strong downtrend, trading significantly below its key moving averages. - What does the RSI level indicate?
RSI near 12 signals extreme oversold conditions, reflecting intense recent selling pressure. - What corporate actions has the company announced?
The company announced a stock split and a 1:2 bonus issue, subject to approvals.