
Highlights
- RBZ Jewellers shares declined nearly 7% amid weakness across jewellery counters.
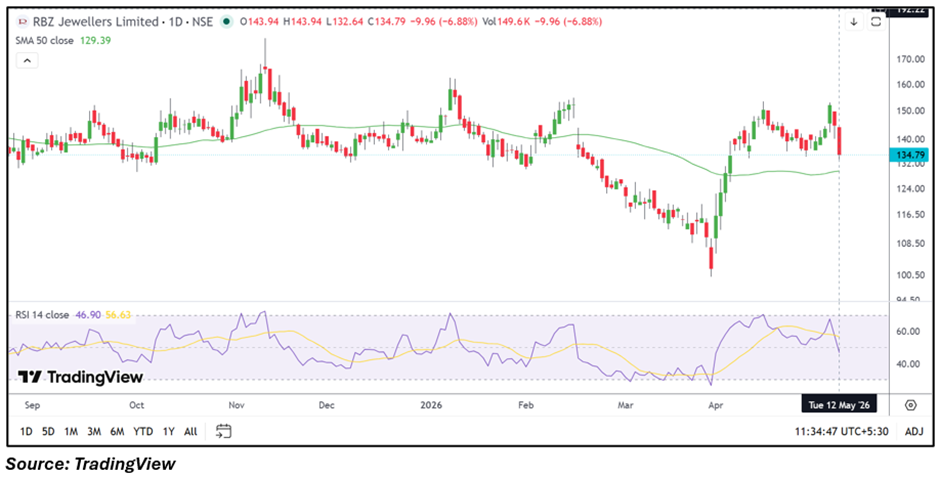
- The stock slipped below its 50-day SMA, indicating softer near-term momentum.
- Investors remained cautious despite the company reporting profitable quarterly numbers.
Overview
RBZ Jewellers Limited (NSE: RBZJEWL) witnessed notable selling pressure on May 12, with the stock falling around 6.83% to ₹134.87 during intraday trade. The decline came after the stock failed to hold recent higher levels, pushing it below key technical zones tracked by short-term traders.
The stock opened at ₹143.94 and touched an intraday low of ₹132.64 before attempting mild stabilization. Broader volatility in jewellery and retail-focused counters also weighed on sentiment during the session.
Fundamental View
For the quarter ended December 2025, RBZ Jewellers reported standalone total income of ₹22,637.07 lakh. Profit before tax stood at ₹2,336.35 lakh, while net profit came in at ₹1,743.01 lakh. Earnings per share for the quarter were reported at ₹4.36.
Despite maintaining profitability, the stock witnessed selling pressure as investors appeared cautious on valuation sustainability and broader weakness in the jewellery segment.
Technical View
RBZ Jewellers stock is currently trading near ₹134.87 and has slipped below its 50-day SMA positioned around ₹129.39 after failing to sustain higher levels near ₹150.00. Price action reflects increased volatility following the recent rebound from April lows.
The 14-day RSI declined near 46.90, slipping below the neutral zone and indicating fading momentum conditions. The sharp intraday correction suggests traders are closely monitoring support stability in the near term.
Momentum Indicator
Momentum has weakened after the RSI reversed sharply from recent highs. A sustained move below the 45 zone may keep short-term sentiment cautious.
Key Technical Levels
- Support Zone: ₹120.00–₹108.00
- Resistance Zone: ₹150.00–₹161.00
Risks to Watch
- Volatility in gold and bullion prices
- Weak sentiment in jewellery counters
- Sharp swings in small-cap stocks
- Profit booking after recent recovery
Summary
RBZ Jewellers shares corrected sharply despite the company remaining profitable in its latest reported quarter. The stock moved below important trading zones while momentum indicators weakened during the session. Investors are likely to monitor whether the stock can stabilize near support levels amid continued volatility in the jewellery segment.
FAQs
Why did RBZ Jewellers stock fall today?
The stock declined amid selling pressure in jewellery counters and weakness after failing to sustain recent higher levels.
What are the important support levels for RBZJEWL?
Key support for the stock is placed around ₹120.00–₹108.00 based on recent price structure.
What does the RSI indicate for RBZ Jewellers?
The RSI near 46.90 suggests weakening short-term momentum and cautious trading sentiment.