
Highlights
- The stock declined sharply and continues trading below its 50-day moving average.
- RSI remains in lower range, indicating weak momentum despite slight recovery.
- Support and resistance levels highlight a narrow range after recent selling pressure.
Readymix Construction Machinery Ltd (NSE:READYMIX) traded near INR 73.00 on March 25, 2026, declining around 14.12% during the session. The stock remains well below its 50-day Simple Moving Average near INR 97.74, indicating a weak broader technical structure.
The price action reflects a continued downward trend, with consistent lower levels being tested in recent sessions. However, a minor bounce from recent lows suggests an early attempt at stabilisation. This movement may indicate temporary support emerging, though the broader trend remains under pressure.
Momentum Indicators Remain Weak
The 14-day Relative Strength Index (RSI) is positioned near 33.05, placing it close to the oversold zone. While the indicator shows slight improvement from earlier levels, it still reflects weak momentum conditions.
An RSI in this range typically signals that selling pressure has been dominant. The recent uptick may indicate some buying interest returning, but a sustained recovery would depend on further strengthening in momentum indicators.
Key Support and Resistance Levels
Readymix Construction Machinery Ltd is currently trading near ₹73.00 as of March 25, 2026, declining around 14.12%, and remains well below its 50-day Simple Moving Average near ₹97.74, indicating a weak broader setup. The price action reflects a continued downward move, with a recent attempt to bounce from lower levels suggesting a minor stabilisation phase.
The 14-day RSI near 33.05 indicates momentum is still in the lower range, though showing slight improvement from oversold conditions. In the near term, support is placed around ₹65.00–₹60.00, while resistance is seen near ₹82.00–₹90.00.
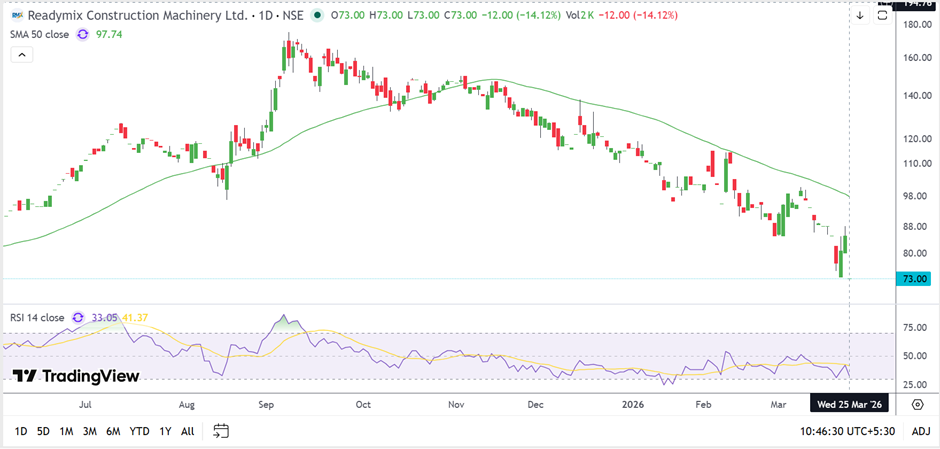
Source: TradingView
Key Risks
- Continued trading below moving averages may indicate prolonged weakness.
- Low RSI levels reflect ongoing selling pressure in the stock.
- Failure to hold support could lead to further downside movement.
- Limited upward momentum may restrict recovery attempts in the near term.
Summary
Readymix Construction Machinery stock remains under pressure, trading well below key moving averages and reflecting a weak broader trend. RSI levels indicate lingering weakness despite a slight recovery from oversold conditions. Price action suggests early stabilisation, but resistance levels may cap upside. Support zones remain critical, as further weakness could lead to additional downside in the near term.
FAQs
- What is the current trend of Readymix Construction Machinery stock?
The stock is in a downtrend, trading below key moving averages despite minor stabilisation attempts. - What does the RSI level indicate?
RSI near 33 suggests weak momentum, with the stock close to oversold conditions. - What are the important support and resistance levels?
Support lies between ₹ 65–60, while resistance is seen in the ₹ 82–90 range.