
Highlights
- Regency Ceramics Ltd stock showed mild gains despite recent downward price pressure.
- RSI recovered above 50, indicating improving momentum after nearing oversold territory.
- Price continues to trade below 50-day moving average, reflecting ongoing broader weakness.
Shares of Regency Ceramics (NSE:REGENCERAM) is trading at ₹43.15 on March 27, 2026, gaining ₹3.65 or 9.24% on the National Stock Exchange of India. The session showed moderate recovery following a sharp decline seen earlier in the week.
Trading volumes remained relatively stable compared to previous sessions, suggesting measured participation rather than aggressive accumulation. The stock attempted to stabilize near lower levels after a recent dip below ₹40.
Trend Analysis: Range-Bound with Downward Bias
The stock has largely moved in a sideways range over the past several months, with intermittent spikes and declines. However, recent price action indicates a slight downward bias as the stock continues to trade below its 50-day moving average near ₹43.98.
Lower highs observed since February 2026 suggest that selling pressure has persisted, limiting sustained upward movement. The latest rebound does not yet confirm a trend reversal but indicates a possible short-term recovery.
Momentum Indicator Insights
The Relative Strength Index (RSI) stands at approximately 52.69, rebounding from levels near 40 earlier in March. This suggests improving momentum, though it remains in a neutral zone rather than signaling strong directional strength.
The RSI trend indicates that the stock is neither overbought nor oversold, leaving room for movement in either direction depending on upcoming price action and volume support.
Key Technical Levels
The stock, is trading at ₹43.15, shows immediate support at ₹38.84 and ₹36.68, which may act as downside cushions. On the upside, resistance at ₹47.47 and ₹49.62 could limit near-term advances. The setup indicates a defined trading band, where a decisive move above resistance or below support.
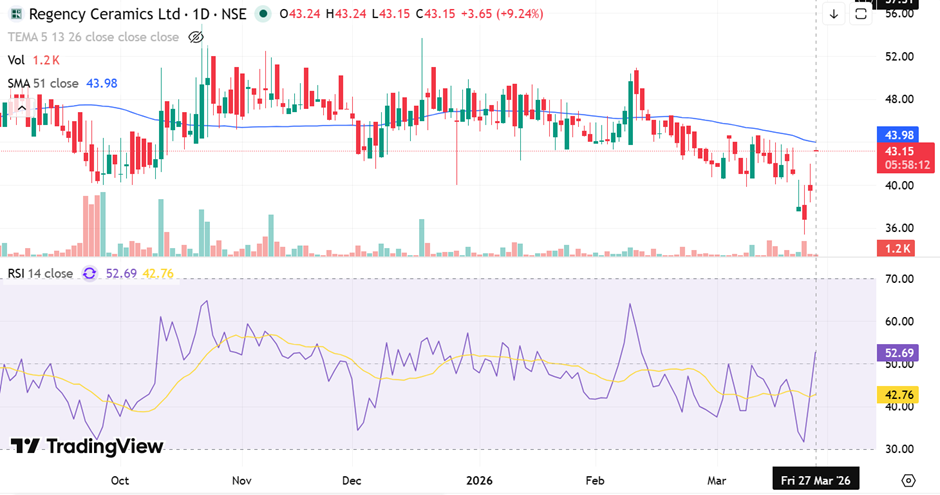
Source: TradingView
Key Risks
- Continued trading below 50-day moving average may maintain downward bias.
- Range-bound movement may limit directional clarity for traders.
- Failure to hold above ₹40 could trigger renewed selling pressure.
- Moderate volumes may weaken sustainability of upward moves.
Summary
Regency Ceramics stock posted a recovery of over 9% in the latest session, rebounding from recent lows. While RSI has moved above 50, indicating improved short-term momentum, the stock remains below its 50-day moving average, reflecting a broader cautious trend. Price action continues within a range, with key support and resistance levels likely to guide near-term direction.
FAQs
- Why did Regency Ceramics stock rise in the latest session?
The stock rebounded after recent declines, with price stabilizing near lower levels and showing mild recovery during the session. - What does the RSI indicate for the stock currently?
RSI around 52 suggests neutral momentum, indicating neither strong buying nor selling pressure dominating currently. - What are the crucial levels to monitor for this stock?
Resistance lies near ₹47.47 and ₹49.62, while support is seen around ₹38.84 and ₹36.68 levels.