
Highlights
- Reliance Power shares surged more than 13% during Wednesday's session, placing the stock among the top gainers on the NSE.
- The company develops, owns, and operates power generation projects across thermal, hydro, solar, and renewable energy segments.
- For the quarter ended March 2026, standalone total income stood at ₹2,428.00 crore, while net profit came in at ₹741.00 crore.
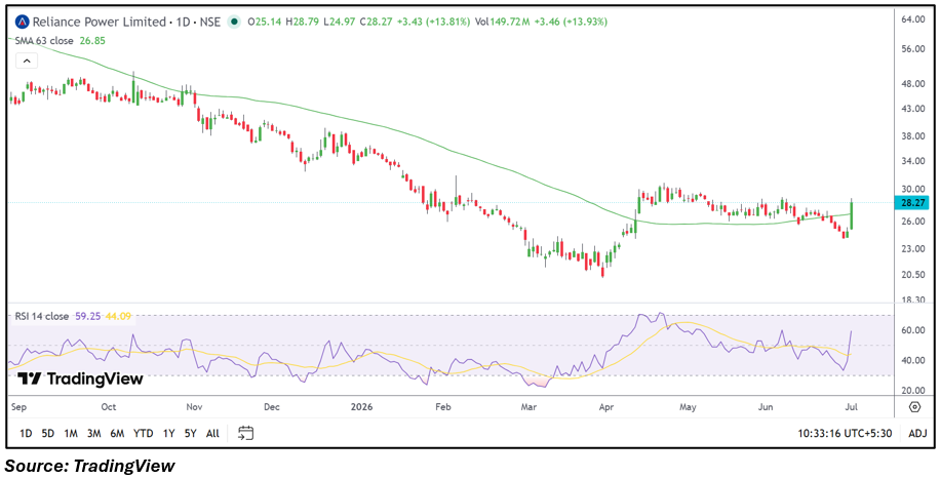
- The stock moved above its 63-day Simple Moving Average, indicating an improvement in the medium-term technical structure.
- RSI climbed close to 60, reflecting strengthening momentum following the sharp rally.
- Investors will monitor project execution, debt reduction initiatives, renewable energy expansion, and upcoming quarterly results.
Overview
Reliance Power Limited is engaged in the development, construction, and operation of power generation projects, with a portfolio spanning thermal, hydroelectric, solar, and other renewable energy assets. The company has also been focusing on strengthening its balance sheet and expanding its presence in the clean energy segment. The stock rallied more than 13% during Wednesday's session, climbing to an intraday high of ₹28.79 before trading around ₹28.20. The sharp move pushed the stock into the list of top gainers as trading volumes rose significantly compared with recent sessions.
Fundamental View
Reliance Power reported a profitable performance in its latest reported quarter. For the quarter ended March 2026, the company posted standalone total income of ₹2,428.00 crore. Profit before tax stood at ₹741.00 crore, while net profit also came in at ₹741.00 crore, with earnings per share of ₹0.02. The company's operational outlook continues to be influenced by developments in the power sector, renewable energy investments, project execution, debt optimisation efforts, and regulatory policies. Future earnings growth, capacity utilisation, and progress on new energy initiatives are likely to remain important business factors.
Technical View
Technically, Reliance Power has witnessed a strong rebound after trading in a relatively narrow range over recent weeks. The stock has moved above its 63-day Simple Moving Average of ₹26.85, indicating an improvement in the medium-term trend. The 14-day Relative Strength Index (RSI) has advanced to around 59.25, reflecting improving momentum following the latest breakout. The sharp rise in price along with higher trading activity suggests stronger market participation, while sustaining above recent breakout levels could influence the stock's near-term technical structure.
Key Technical Levels
Immediate support is placed near ₹27.40, followed by the next support around ₹26.60. On the upside, immediate resistance is seen near the day's high of ₹28.79, while the next resistance is placed around ₹29.40. These levels may influence the stock's price movement if volatility remains elevated.
Risks to Watch
- Regulatory and policy changes in the power sector.
- Project execution delays.
- Debt servicing and financing costs.
- Fluctuations in fuel and operating expenses.
- Overall market volatility.
Summary
Reliance Power returned to the spotlight after posting a strong double-digit gain during Wednesday's trading session. The company continues to strengthen its position across conventional and renewable power generation while reporting a profitable quarterly performance. The latest rally has improved the stock's technical structure, with future movement likely to depend on business execution, sector developments, financial performance, and its ability to sustain above important technical levels.
FAQs
Q: What does Reliance Power do?
Reliance Power develops, owns, and operates power generation projects across thermal, hydroelectric, solar, and renewable energy segments.
Q: Why did Reliance Power shares rise today?
The stock witnessed strong price momentum along with increased trading activity, helping it emerge among the top gainers on the NSE.
Q: How did Reliance Power perform in the latest quarter?
For the March 2026 quarter, the company reported standalone total income of ₹2,428.00 crore and net profit of ₹741.00 crore.
Q: What does the technical chart indicate?
The stock is trading above its 63-day Simple Moving Average, while the RSI reflects improving momentum following the recent breakout.
Q: What should investors monitor going forward?
Key factors include quarterly financial performance, renewable energy expansion, project execution, regulatory developments, and balance sheet improvements.