
Highlights
- Ruchi Infrastructure Limited shares declined 5.43% to ₹6.10 on April 13, 2026.
- The stock gave up part of its recent rebound after failing to sustain above ₹6.50.
- Momentum cooled even though the stock remains above its 50-day SMA near ₹5.73.
Overview
Ruchi Infrastructure Limited (NSE: RUCHINFRA) fell 5.43% to ₹6.10 on April 13, 2026, after opening at ₹6.45 and slipping to an intraday low of ₹5.95. The stock turned lower after witnessing a sharp recovery from its recent March lows.
The latest move suggests that the rebound has started to lose pace after the stock failed to build on last week’s strong rise. Despite the decline, the stock is still trading above its 50-day Simple Moving Average.
Fundamental View
Ruchi Infrastructure reported a modest improvement in profitability in the December 2025 quarter. The company posted total income of ₹1,148.00 lakh.
Profit before tax came in at ₹108.00 lakh, while net profit stood at ₹82.00 lakh. Earnings per share remained flat at ₹0.00, indicating that the company is still operating with limited profitability despite returning to profit.
Technical View
Ruchi Infrastructure had rallied sharply from below ₹4.50 to above ₹6.80 in a short period, creating a steep recovery pattern on the chart. However, the latest session indicates that the stock is now facing pressure after that rapid rise.
The stock failed to sustain near the upper end of its recent range and formed another red candle after opening flat. This suggests that sellers have become more active around higher levels, especially after the stock approached the ₹6.50–7.10 region.
Even after the recent decline, the stock continues to trade above its 50-day Simple Moving Average near ₹5.73. The 14-day RSI stands at 55.70, which shows that momentum is still positive, although it has cooled from the higher levels seen during the recent rally.
Key Technical Levels
The ₹5.50–5.00 region may now act as an important area to watch if the stock continues to drift lower. On the upside, the ₹6.50–7.10 zone remains the key hurdle, as the recent rebound has already started facing pressure near this band.
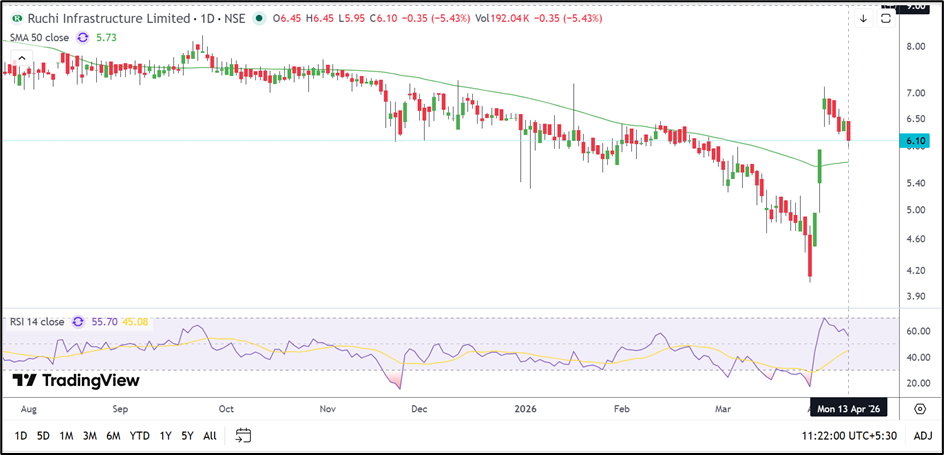
Source: TradingView
Risk to Watch
- The recent rebound may weaken further if the stock slips below ₹5.50.
- The stock has already started facing pressure near its recent high.
- Low-priced stocks can remain highly volatile even during small moves.
- Failure to sustain above the 50-day SMA could weaken the recovery trend.
Summary
Ruchi Infrastructure has corrected after a sharp rally from recent lows. Although the stock remains above its 50-day SMA, the latest session indicates that the rebound is facing pressure near higher levels. The next few sessions may determine whether the stock stabilises or extends the recent decline.
FAQs
Why did Ruchi Infrastructure share price fall today?
The stock declined after failing to sustain its recent rebound and faced pressure near the ₹6.50–7.10 zone.
What is the 50-day SMA for Ruchi Infrastructure?
The 50-day Simple Moving Average for the stock is currently near ₹5.73.
How much profit did Ruchi Infrastructure report in December 2025?
Ruchi Infrastructure reported a net profit of ₹82.00 lakh in the December 2025 quarter.