
Highlights
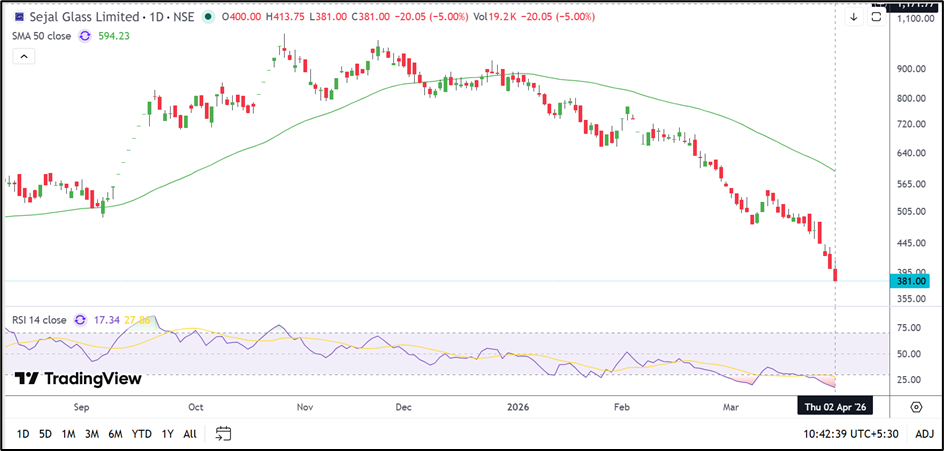
- Sejal Glass Limited (NSE: SEJALLTD) declined 5.00% to INR 381.00 on 2 April 2026.
- The stock remains far below its 50-day Simple Moving Average near INR 594.23.
- December 2025 quarter net loss stood at INR 174.12 lakh.
Sejal Glass Limited (NSE: SEJALLTD) remained under pressure in Thursday’s session, falling 5.00% to INR 381.00. The stock opened at INR 400.00 and moved between an intraday high of INR 413.75 and a low of INR 381.00. VWAP for the session stood at INR 385.08.
The decline came as Sejal Glass Limited (NSE: SEJALLTD) continued its broader downtrend, with the stock extending losses after failing to hold above the INR 400.00 mark. The chart reflects persistent weakness, as the stock has continued to post lower highs and lower lows over recent weeks.
Fundamental View
For the quarter ended 31 December 2025, Sejal Glass Limited (NSE: SEJALLTD) reported total income of INR 3,102.24 lakh. The company posted a loss before tax of INR 174.12 lakh, while net loss also came in at INR 174.12 lakh. Earnings per share for the quarter stood at negative INR 1.69.
The latest quarterly numbers suggest that the company continues to face profitability pressure. Weak earnings and a declining price trend have added to the cautious sentiment around the stock.
Technical View
Sejal Glass Limited (NSE: SEJALLTD) is currently trading near INR 381.00 and remains significantly below its 50-day Simple Moving Average near INR 594.23. The sharp gap between the stock price and the moving average indicates that the broader trend continues to remain weak.
The latest chart shows that the stock has slipped toward a fresh low zone after repeated failure near the INR 500.00 and INR 450.00 regions. Price action has turned increasingly weak, with the recent fall dragging the stock below the INR 400.00 mark.
The 14-day RSI is near 17.34, indicating that the stock has entered an oversold zone after the recent slide. While such readings can sometimes lead to a short-term rebound, the overall structure still points to continued weakness unless the stock is able to reclaim higher levels.
Key Technical Levels
Immediate support is placed near INR 360.00, followed by a lower zone around INR 345.00. On the upside, the stock may face resistance in the INR 400.00–425.00 range.
A move back above INR 400.00 could help the stock stabilise, while continued trading below INR 360.00 may keep the downtrend intact.
Source: TradingView
Risks To Watch
- Sustained weakness below INR 360.00 may increase downside pressure.
- The stock remains sharply below its 50-day moving average.
- Weak quarterly earnings continue to weigh on sentiment.
- High volatility may persist after the recent decline.
Summary
Sejal Glass Limited (NSE: SEJALLTD) fell 5.00% to INR 381.00 and continues to trade in a weak structure below its 50-day moving average near INR 594.23. The latest quarter also reflected pressure, with the company reporting a net loss of INR 174.12 lakh. RSI near 17.34 suggests the stock is oversold, although the broader trend remains negative.