
Highlights
- SEPC (NSE: SEPC) advanced 17.95% to INR 6.90.
- The stock is attempting to recover after recent weakness.
- December 2025 quarter net profit stood at INR 1,496.00 lakh.
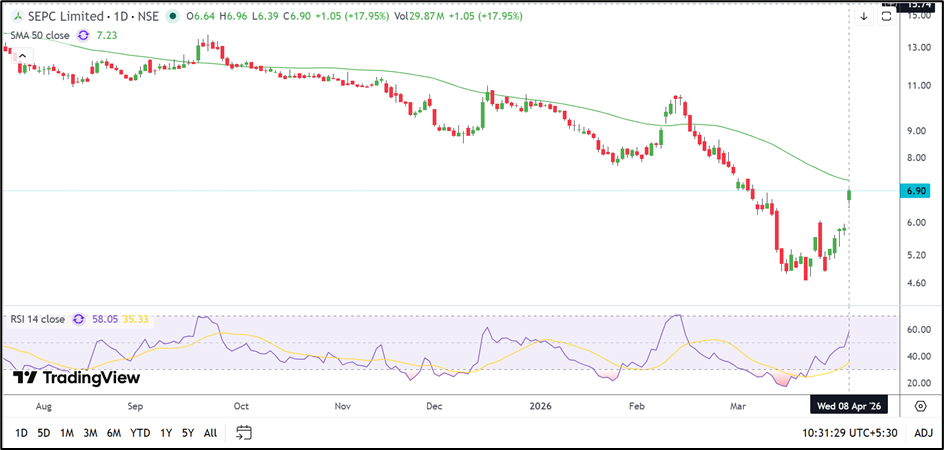
SEPC (NSE: SEPC) moved sharply higher on 8 April 2026, with the stock climbing 17.95% to INR 6.90. The share opened at INR 6.64 and extended gains through the session, touching an intraday high of INR 6.96. The day’s low remained at INR 6.39, while VWAP stood at INR 6.62.
The latest move comes after a steep correction over the past several weeks. SEPC (NSE: SEPC) had fallen toward the INR 5.00 zone before witnessing a strong rebound. The stock is still trading slightly below its 50-day Simple Moving Average near INR 7.23, but the recent rise suggests that selling pressure may be easing.
Fundamental View
For the quarter ended 31 December 2025, SEPC (NSE: SEPC) reported consolidated total income of INR 34,207.00 lakh. Profit before tax came in at INR 1,746.00 lakh, while net profit stood at INR 1,496.00 lakh. Earnings per share for the quarter was INR 0.08.
The company remained profitable during the December quarter despite weakness in the share price. The latest earnings may be helping improve investor sentiment as the stock attempts to stabilise from recent lows.
Technical View
SEPC (NSE: SEPC) is currently trading near INR 6.90 after rebounding sharply from the INR 5.00–5.20 region. The latest candle reflects strong momentum and indicates that buyers have returned after an extended decline.
Although the stock remains below its 50-day moving average near INR 7.23, the rebound has improved the short-term structure. The recent price action suggests that the earlier downtrend is slowing and that the stock may continue to recover if it manages to stay above the breakout zone.
The 14-day RSI has risen to around 58.05 and remains comfortably above its signal line near 35.33. This suggests that momentum has turned positive, though the stock is not yet in overbought territory.
If SEPC (NSE: SEPC) sustains above INR 6.30, the rebound may continue over the coming sessions. A move above the 50-day moving average would further strengthen the near-term outlook.
Key Technical Levels
Immediate support is placed near INR 6.30. If the stock slips below this level, the next support zone is seen near INR 5.80.
On the upside, the first hurdle is likely near INR 7.50. A stronger barrier remains around INR 8.00.
Source: TradingView
Risks To Watch
- The stock is still trading below its 50-day moving average.
- Failure to hold above INR 6.30 may weaken the rebound.
- Resistance near INR 7.50–8.00 could limit the upside.
- The stock has remained volatile over the last few weeks.
Summary
SEPC (NSE: SEPC) has staged a notable recovery after rising nearly 18% from recent lows. Momentum indicators have improved and the broader structure is beginning to stabilise, although the stock still trades below its 50-day moving average. Support is placed near INR 6.30–5.80, while higher levels may face pressure near INR 7.50–8.00.
FAQs
- Why did SEPC (NSE: SEPC) rise today?
The stock rebounded strongly after recovering from recent lows and attracting fresh buying interest. - What were SEPC’s December 2025 quarterly results?
The company reported consolidated total income of INR 34,207.00 lakh and net profit of INR 1,496.00 lakh. - Is SEPC still below its 50-day moving average?
Yes, the stock is trading below its 50-day Simple Moving Average near INR 7.23.