
Highlights
- Graphite India Limited stock surged over 8% with strong trading volumes on NSE.
- RSI rebounded above 50, indicating improving momentum after recent weakness.
- Price moved above 50-day moving average, signaling a potential short-term trend shift.
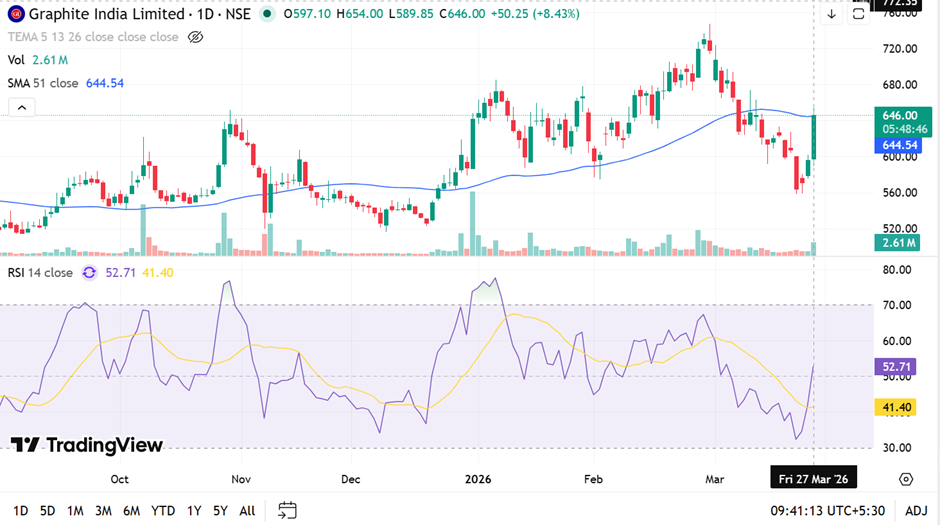
Shares of Graphite India (NSE:GRAPHITE) is trading at ₹646.00 on March 27, 2026, gaining ₹50.25 or 8.43% on the National Stock Exchange of India. The session recorded a noticeable increase in trading volumes, reflecting heightened market participation.
The stock registered a sharp upward move after a recent decline, forming a strong bullish candle. This move helped the price recover significantly from recent lows near ₹590 levels.
Trend Analysis: Attempt to Reverse Recent Weakness
The stock has shown mixed price action over recent months, with alternating phases of gains and declines. The latest move pushed the stock above its 50-day moving average near ₹644.54, which may indicate a shift in short-term trend direction.
Earlier, the stock faced selling pressure after reaching higher levels above ₹700, followed by a correction phase. The current rebound suggests a possible recovery, though sustained movement above the moving average will be key for confirmation.
Momentum Indicators Reflect Recovery
The Relative Strength Index (RSI) stands at approximately 52.71, recovering from lower levels near 40 earlier in March. This indicates improving momentum, though still within a neutral range.
The RSI suggests that the stock is not in overbought territory, leaving room for further price movement depending on market conditions and follow-through buying.
Key Technical Levels
Trading At ₹646.00, the stock has immediate support at ₹581.40 and ₹549.10, which may act as downside buffers. On the upside, resistance levels at ₹710.60 and ₹742.90 could cap near-term advances. The price remains range-bound, and a decisive breakout above resistance or breakdown below support.
Source: TradingView
Key Risks
- Failure to sustain above 50-day moving average may weaken recovery.
- Recent volatility may lead to sharp price swings.
- Resistance near ₹710–₹740 zone could limit upside.
- Volume spike may not sustain in upcoming sessions.
Summary
Graphite India stock recorded a strong gain of over 8% supported by increased trading volumes. The move pushed the stock above its 50-day moving average, indicating a possible shift in short-term trend. RSI recovery above 50 reflects improving momentum, though the broader trend requires further confirmation. Key support and resistance levels will remain important for assessing near-term direction.
FAQs
- Why did Graphite India stock rise sharply in the latest session?
The stock gained over 8% due to strong buying activity accompanied by a noticeable increase in trading volumes. - What does the RSI indicate for Graphite India stock?
RSI around 52 suggests improving momentum, though it remains neutral and not in overbought territory currently. - What are the important levels to watch for this stock?
Resistance levels are ₹710.60 and ₹742.90, while support levels are ₹581.40 and ₹549.10.