
Highlights
- The stock is hovering near its 50-day SMA, indicating a range-bound structure.
- RSI reflects mildly positive momentum, suggesting gradual improvement in price action.
- Key resistance levels remain ahead, which may limit immediate upside movement.
Magnum Ventures Limited (NSE:MAGNUM) is trading near INR 21.55, reflecting a marginal gain of around 0.14% in the latest session. The stock is currently hovering close to its 50-day simple moving average at INR 20.81, indicating that the broader structure remains range-bound in the near term.
Prices have recovered from recent lows of INR 16.25 recorded in March 2026 and are attempting to sustain above the moving average. This suggests that near-term momentum is gradually improving, although a decisive breakout is yet to be established. Immediate support is placed in the INR 20.00–18.50 zone, while resistance is seen between INR 23.50 and INR 25.00.
Momentum Indicators Show Mild Strength
The 14-day Relative Strength Index (RSI) stands near 56.54, indicating mildly positive momentum with scope for further upside. This level reflects a balanced trend, where buying interest is present but not in overbought territory.
The intraday range between INR 21.49 and INR 22.09 highlights relatively controlled volatility. The VWAP at INR 21.55 suggests that the stock is trading in line with its average price, reinforcing the ongoing consolidation phase. Daily volatility stands at 3.37, while annualised volatility is at 64.38, indicating potential for price swings despite the current range-bound movement.
Returns Indicate Mixed Performance
Magnum Ventures has shown mixed returns across timeframes. Over the past week, the stock declined 3.20%, underperforming the NIFTY 50, which gained 1.09%. However, on a one-month basis, the stock rose 14.36%, outperforming the broader market.
Year-to-date returns stand at -6.20%, slightly better than the index decline of -7.02%. Over longer periods, the stock has declined 20.75% over one year and 25.01% over three years. However, five-year returns remain significantly elevated at 407.08%, reflecting strong long-term gains despite recent underperformance.
Business Overview and Trading Activity
Magnum Ventures operates in the paper and hotel industries, with over three decades of presence in paper manufacturing, including products such as newsprint and duplex boards. The company has an established footprint in the northern region of India.
The stock recorded traded volume of 0.23 lakh shares, translating into a traded value of INR 0.05 crore. The total market capitalisation stands at INR 147.08 crore, with free float market cap at INR 61.61 crore. The impact cost of 1.22 indicates moderate liquidity conditions, which may influence price movement during volatile sessions.
Technical Summary
Magnum Ventures Limited is trading near ₹21.55, up around 0.14%, and is hovering close to the 50-day SMA near ₹20.81, indicating that the broader structure remains range-bound in the near term.
With the 14-day RSI near 56.54 points to mildly positive momentum with room for further upside. Immediate support is placed in the ₹20.00–18.50 zone, while resistance is seen near the ₹23.50–25.00 range.
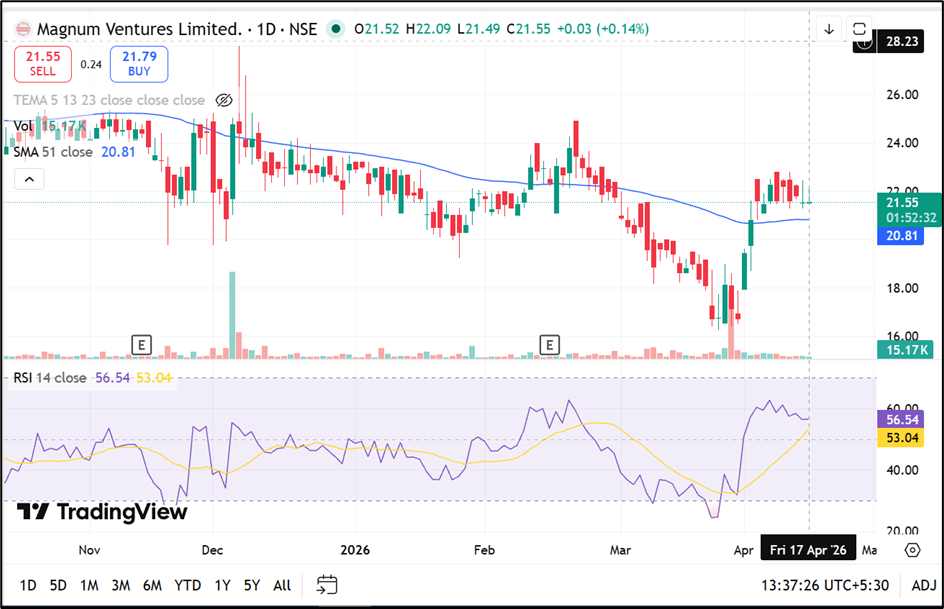
Source: TradingView
Key Risks to Monitor
- Range-bound structure may limit short-term price movement.
- Resistance zone near INR 23.50–25.00 could cap upside.
- Moderate liquidity may increase volatility during market fluctuations.
- Longer-term negative returns may weigh on sentiment.
Summary
Magnum Ventures Limited is currently trading near its 50-day SMA, reflecting a range-bound trend with gradually improving momentum. While RSI indicates mild strength, the absence of a strong breakout keeps the near-term outlook neutral. Key resistance levels ahead and mixed return profile suggest that price movement may remain within a defined range unless supported by stronger directional cues.
FAQs
What does trading near the 50-day SMA indicate?
It suggests a neutral trend, where the stock is consolidating without a clear directional breakout.
Is the RSI level supportive of further upside?
RSI near 56 indicates mild strength, leaving room for gradual upward movement if momentum sustains.
What are the key support and resistance levels?
Support is placed at INR 20–18.50, while resistance is observed between INR 23.50 and INR 25.00.