
Highlights
- SBI stock rises over 3% intraday with price nearing recent trading highs.
- Long-term returns significantly outperform NIFTY 50 across 1-year and 5-year periods.
- Financial performance reflects steady profitability with consistent earnings growth in latest quarter.
State Bank of India (NSE:SBIN) is trading at INR 1,114.40, up 3.16% from the previous close of INR 1,080.25. The stock touched an intraday high of INR 1,120.95 and a low of INR 1,075.85, indicating active participation during the session.
The volume-weighted average price (VWAP) stands at INR 1,109.83, with daily volatility at 1.53% and annualised volatility at 29.23%. The stock remains below its 52-week high of INR 1,234.70 but significantly above its 52-week low of INR 755.50.
Return Performance Across Timeframes
SBI has delivered strong returns across multiple periods. The stock gained 4.79% over one week and 5.34% over one month, broadly in line with or slightly below the NIFTY 50 in the short term.
On a longer horizon, performance stands out. Year-to-date returns are at 13.17% compared to a decline of 6.47% in the NIFTY 50. One-year returns are at 39.75%, while three-year and five-year returns stand at 104.56% and 238.22%, respectively, indicating sustained appreciation over time.
Liquidity and Market Capitalisation
The stock recorded traded volume of 172.50 lakh shares, translating into traded value of INR 1,914.42 crore. Deliverable quantity stood at 60.26%, suggesting higher investor participation beyond intraday trades.
Total market capitalisation is reported at INR 10,29,075.40 crore, with a free float market cap of INR 4,61,565.19 crore. The impact cost of 0.01 reflects high liquidity and efficient price discovery.
Financial Snapshot
For the quarter ended December 31, 2025, consolidated total income stood at INR 1,85,64,833 lakh, while net profit was INR 21,87,604 lakh, resulting in earnings per share (EPS) of INR 23.09.
On a standalone basis, total income was INR 1,40,91,465 lakh with net profit at INR 21,02,815 lakh and EPS at INR 22.78. The figures indicate continued profitability in the reported quarter.
Business Overview
State Bank of India (NSE:SBIN) is a public sector banking and financial services institution headquartered in Mumbai. It operates across retail banking, corporate banking, and financial services, with a presence spanning domestic and international markets.
As one of India’s largest banking institutions, it plays a significant role in credit delivery and financial intermediation across sectors of the economy.
Technical Summary
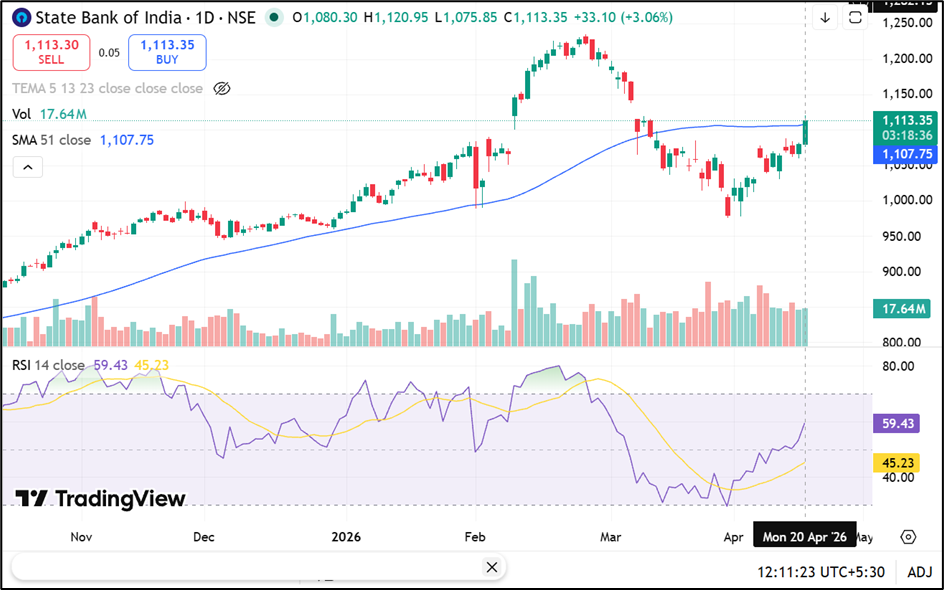
State Bank of India (NSE:SBIN) is trading near ₹1,113.35, up around 3.06% on 20 April 2026, and has reclaimed a position slightly above the 51-day SMA near ₹1,107.75, while the 14-day RSI near 59.43. Immediate support is placed in the ₹1,080.00–1,030.00 zone, while resistance is seen near the ₹1,150.00–1,220.00 range.
Key Risks
- Interest rate changes may impact net interest margins.
- Asset quality pressures could affect profitability.
- Macroeconomic slowdown may influence credit demand.
- Regulatory changes may alter banking sector dynamics.
Summary
State Bank of India (NSE:SBIN) is trading higher in the current session, supported by strong long-term return performance and high liquidity. While short-term returns remain moderate, the stock has outperformed the broader market over longer periods. Financials indicate stable profitability, and the bank continues to maintain a significant presence in India’s financial system.
FAQs
- How has SBI stock performed recently?
SBI stock has gained over 3% intraday and delivered positive returns across short- and long-term periods compared to benchmarks. - How does SBI compare with NIFTY 50 performance?
It has outperformed the NIFTY 50 on a year-to-date and long-term basis, though short-term returns are relatively aligned. - What are the latest financial highlights of SBI?
The bank reported consolidated net profit of INR 21,87,604 lakh with EPS of INR 23.09 for the latest quarter.