
Highlights
- Shree Rama Multi-Tech shares declined nearly 10% despite reporting quarterly profitability.
- Investors reacted cautiously as selling pressure intensified during intraday trade.
- The stock slipped below its 50-day moving average amid weakening short-term momentum.
Overview
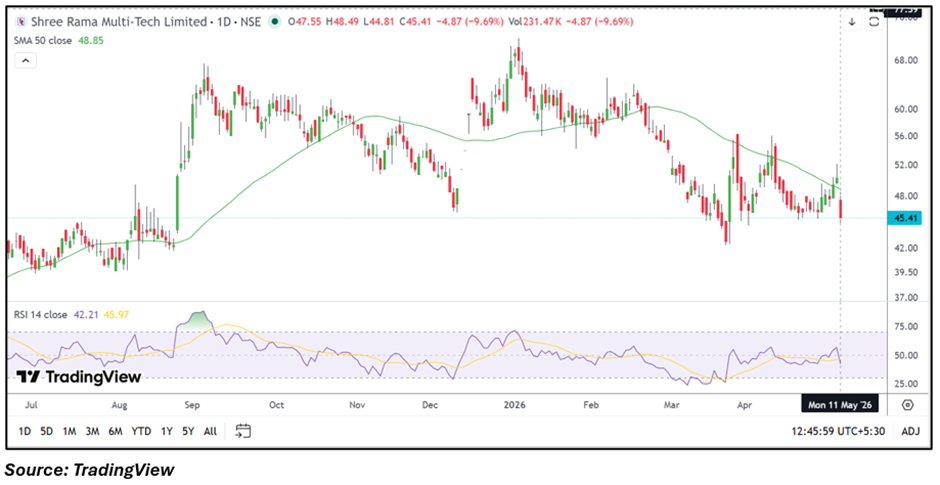
Shree Rama Multi-Tech Limited (NSE: SHREERAMA) witnessed sharp selling pressure on May 11, with the stock falling 9.69% to around INR 45.41 during intraday trade. The decline came even after the company reported profit for the March 2026 quarter, reflecting cautious market sentiment and profit-booking activity near recent recovery levels.
The stock opened at INR 47.55 and touched an intraday low of INR 44.81. Trading activity remained elevated through the session, indicating increased volatility as traders reduced positions after the recent move higher.
Fundamental View
For the quarter ended March 2026, the company reported standalone total income of INR 6,258.97 lakh. Profit before tax stood at INR 638.99 lakh, while net profit came in at INR 471.54 lakh. Earnings per share for the quarter stood at INR 0.33.
Despite the profitable quarter, investors appeared cautious regarding sustainability of earnings momentum and broader growth visibility. Midcap counters with relatively higher volatility have also witnessed sharp swings in recent sessions, contributing to pressure on sentiment.
Technical View
Shree Rama Multi-Tech is currently trading below its 50-day simple moving average near INR 48.85, indicating a weak near-term structure. The latest decline reversed part of the recent recovery attempt and pushed the stock back toward lower support zones.
The 14-day RSI slipped near 42.21, reflecting weakening momentum after failing to sustain above stronger resistance levels. Price action suggests sellers regained control after the stock failed to hold gains during the session.
Momentum Indicator
Momentum indicators currently point toward fading short-term strength as volatility increased sharply. The stock has remained highly reactive to broader market sentiment and short-term trading activity.
Key Technical Levels
- Immediate support is placed around INR 41–38.
- A breakdown below INR 41 may increase downside pressure further.
- Immediate resistance is seen near INR 50–54.
- Sustained recovery above INR 54 may improve near-term sentiment.
Risk to Watch
- Shree Rama multi-Tech remains vulnerable to sharp price volatility.
- Weak momentum may continue to pressure short-term price action.
- Failure to hold support levels could trigger additional selling.
- Broader market weakness may impact midcap sentiment further.
Summary
Shree Rama multi-Tech shares declined sharply despite reporting quarterly profit, as investors reacted cautiously amid volatile market conditions and fading momentum. The stock slipped below its 50-day SMA, while technical indicators reflected weakening near-term strength after a failed recovery attempt. Traders may continue monitoring support near INR 41–38 and resistance around INR 50–54 for further directional cues in coming sessions.
FAQs
Why did Shree Rama Multi-Tech shares fall despite profit reporting?
The stock declined due to profit booking, weak momentum, and cautious market sentiment despite quarterly profitability.
What are the key support levels for SHREERAMA stock?
Immediate support for the stock is placed around INR 41–38.
What resistance levels should investors watch now?
Key resistance for Shree Rama Multi-Tech is placed near INR 50–54.