

Highlights
- Silly Monks Entertainment Limited fell 5.50% to ₹16.51 on April 16, 2026.
- The stock failed to hold above the recent rebound zone near ₹17.90.
- Silly Monks continues to trade only slightly above its 21-day SMA of ₹16.00.
Overview
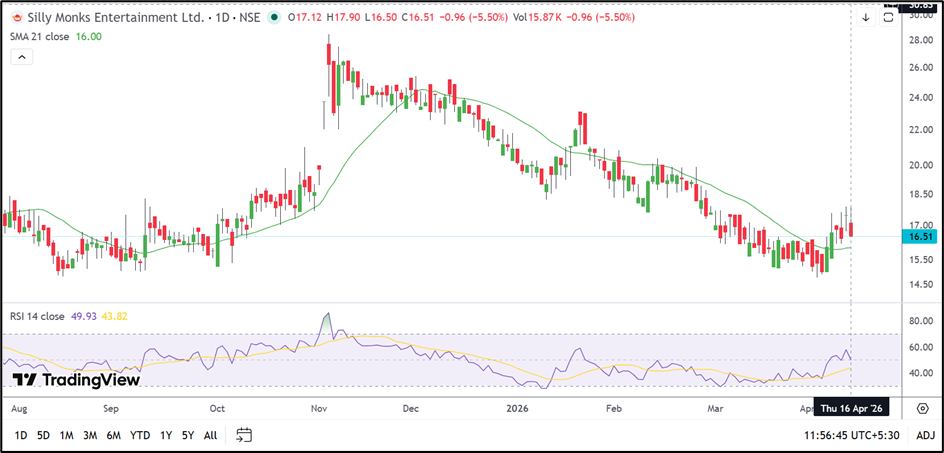
Silly Monks Entertainment Limited (NSE: SILLYMONKS) declined 5.50% to ₹16.51 after opening at ₹17.12 and touching an intraday high of ₹17.90. The stock later slipped to a low of ₹16.50, giving up most of the gains seen earlier this month.
After recovering from the March low near ₹15.00, the stock had started to move above its short-term average. However, the latest session suggests that the rebound is struggling to continue as sellers reappeared near the ₹18.00 area.
Fundamental View
For the quarter ended December 2025, Silly Monks Entertainment reported consolidated total income of ₹565.90 lakh.
The company posted a loss before tax of ₹67.11 lakh, while consolidated net loss stood at ₹66.95 lakh. Earnings per share came in at negative ₹0.65.
The latest quarterly performance indicates that the company is still operating under pressure, and the recent recovery in the share price has not yet been supported by an improvement in earnings.
Technical View
Silly Monks is still holding marginally above its 21-day Simple Moving Average of ₹16.00, but the chart now shows hesitation after the recent rebound. The stock attempted to move higher toward ₹18.00 but failed to sustain that move and reversed sharply during the latest session.
The current candle reflects rejection near the upper end of the recent trading range. Unless the stock quickly moves back above ₹17.90, the recovery may slow further and shift into a sideways-to-weaker pattern.
The 14-day RSI has eased to 49.93, slipping back below the recent highs near 55.00. That suggests momentum has moderated and the stock no longer has the same upward push seen earlier in April.
Key Technical Levels
Immediate support is placed in the ₹15.40–14.40 zone. If the stock slips below this area, it may revisit the March lows.
On the upside, the ₹18.00–19.00 region remains the main resistance band. A sustained move above ₹19.00 would be needed to improve the short-term structure again.
Source: TradingView
Risks to Watch
- The stock has again failed near the ₹18.00 zone.
- Quarterly results continue to show losses.
- A close below ₹15.40 could weaken the recent rebound further.
- Low trading activity may keep price swings volatile.
Summary
Silly Monks Entertainment has lost momentum after its early April recovery and is now drifting back toward its short-term support zone. The stock is still slightly above its 21-day average, but the rejection near ₹17.90 and weaker RSI suggest that the rebound is becoming fragile. The next few sessions may decide whether the stock stabilises above ₹15.40 or moves back toward its recent lows.
FAQs
Why did Silly Monks Entertainment share price fall today?
The stock declined after failing to sustain above the recent rebound area near ₹17.90.
Is Silly Monks Entertainment still above its 21-day SMA?
Yes. The stock is trading slightly above its 21-day SMA of ₹16.00.
Did Silly Monks Entertainment report a profit in the December 2025 quarter?
No. The company reported a consolidated net loss of ₹66.95 lakh.