
Highlights
- SML Mahindra Ltd (NSE: SMLMAHINDRA) declined 6.82% to ₹4,027.00 after slipping near the session low of ₹4,012.70.
- The stock is now trading below its 21-day SMA of ₹4,094.08, suggesting that near-term momentum has weakened.
- SML Mahindra reported standalone net profit of ₹1,754.00 lakh for the December 2025 quarter.
Overview
SML Mahindra Ltd (NSE: SMLMAHINDRA) fell 6.82% to ₹4,027.00 after opening at ₹4,166.50 and touching an intraday high of ₹4,275.00. The stock remained under pressure through the session and closed near the day’s low.
The decline has pushed SML Mahindra below the ₹4,100.00 mark for the first time in several sessions. After a sharp rally earlier this year, the stock now appears to be losing momentum and may be entering a fresh consolidation phase.
Fundamental View
For the quarter ended December 2025, SML Mahindra reported standalone total income of ₹54,083.00 lakh.
Profit before tax stood at ₹2,352.00 lakh, while net profit came in at ₹1,754.00 lakh. Earnings per share was ₹12.11.
The company continues to remain profitable despite the recent weakness in the share price. However, the market is currently reacting more to the fading momentum in the chart structure.
Technical View
SML Mahindra is now trading below its 21-day Simple Moving Average of ₹4,094.08, which indicates that the recent uptrend has weakened.
The stock had been attempting to hold the ₹4,200.00–4,300.00 region during the past few sessions, but the latest decline has pulled it beneath this range. The failure to hold near the recent highs suggests that the stock may remain volatile in the short term.
The 14-day RSI has eased to 46.50, showing that momentum has moderated from earlier elevated levels. The RSI is now close to the neutral zone, indicating that the stock may continue to trade within a wider range unless fresh buying emerges.
Key Technical Levels
The ₹3,700.00–3,400.00 area may now act as the next important support zone if the current weakness continues. A move toward this band could provide some stability after the recent decline.
On the upside, the stock may face resistance around ₹4,400.00–4,650.00. Unless SML Mahindra moves back above this region, the broader near-term structure may remain subdued.
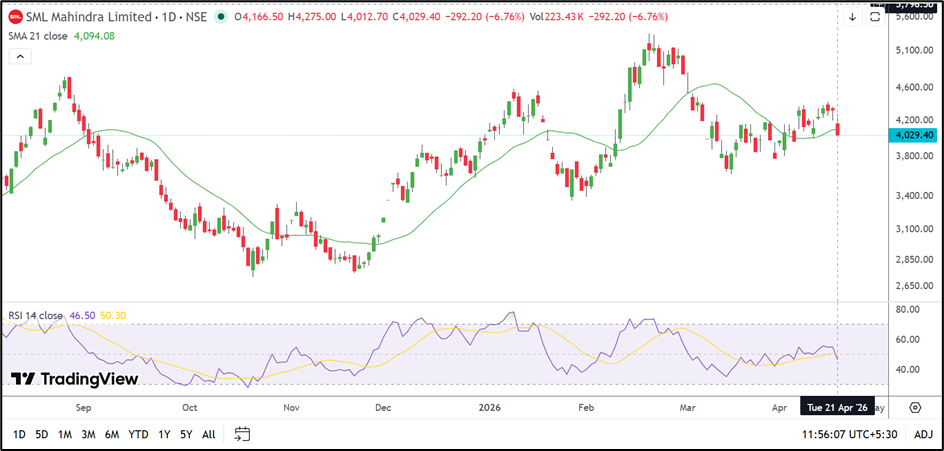
Source: TradingView
Risks to Watch
- The stock has slipped below its 21-day SMA, weakening the recent upward trend.
- Continued weakness below ₹4,000.00 may increase the risk of a move toward lower support levels.
- The stock has shown very high volatility over the past year, which can lead to sharp swings in either direction.
- Although the company remains profitable, the chart setup has weakened in the near term.
Summary
SML Mahindra Ltd (NSE: SMLMAHINDRA) has lost momentum after failing to hold above the ₹4,200.00 zone. The stock is now trading below its 21-day SMA and the recent chart structure has softened.
While the company continues to report healthy profits, the technical picture suggests that the stock may remain under pressure unless it reclaims the ₹4,400.00–4,650.00 region.
FAQs
Why did SML Mahindra share price fall today?
The stock declined after failing to hold above the recent ₹4,200.00–4,300.00 range and witnessing broad-based selling.
Is SML Mahindra trading below its 21-day SMA?
Yes. SML Mahindra is trading below its 21-day SMA of ₹4,094.08.
What are the next key levels for SML Mahindra?
The stock may find support near ₹3,700.00–3,400.00, while resistance is likely around ₹4,400.00–4,650.00.