
Highlights
- STL Networks Limited jumped 14.51% to ₹28.85 on April 20, 2026.
- The stock has moved sharply above its 21-day SMA of ₹19.90 after a rapid rebound from the April low.
- Immediate support is placed at ₹27.50–26.00, while resistance is seen near ₹31.00–33.50.
Overview
STL Networks Limited (NSE: STLNET) climbed 14.51% to ₹28.85 after opening at ₹26.50 and touching an intraday high of ₹29.88. The stock has now gained strongly for several sessions and is trading at its highest level in more than six months.
The latest move has come after a sharp reversal from the April low near ₹16.00. The stock has quickly recovered lost ground and is now approaching the ₹30.00 mark, which may become an important near-term hurdle.
Fundamental View
For the quarter ended December 2025, STL Networks reported standalone total income of ₹31,479.00 lakh.
The company reported a loss before tax of ₹190.00 lakh, while net loss stood at ₹224.00 lakh. Earnings per share remained negative at ₹0.04.
Although the recent quarter remained weak, the latest rally suggests that the market is focusing more on the sharp improvement in price action than on the current earnings profile.
Technical View
The technical structure has changed dramatically over the last few weeks. STLNET is now trading far above its 21-day Simple Moving Average of ₹19.90, showing that the short-term trend has turned decisively higher.
The stock has also broken above multiple earlier swing levels with a series of strong bullish candles. This indicates that the recovery is no longer just a short bounce and may be developing into a broader reversal.
However, momentum has become extremely stretched. The 14-day RSI has surged to 84.33, which places the stock in deep overbought territory. Such readings often lead to short-term volatility or profit-booking after a rapid rise.
Even so, as long as STLNET remains above the ₹27.50 area, the present uptrend may continue.
Key Technical Levels
The ₹27.50–26.00 zone may now act as the first support area if the stock sees a near-term pullback.
On the upside, resistance is placed near ₹31.00–33.50. A breakout above ₹33.50 may open the possibility of a further extension in the coming sessions.
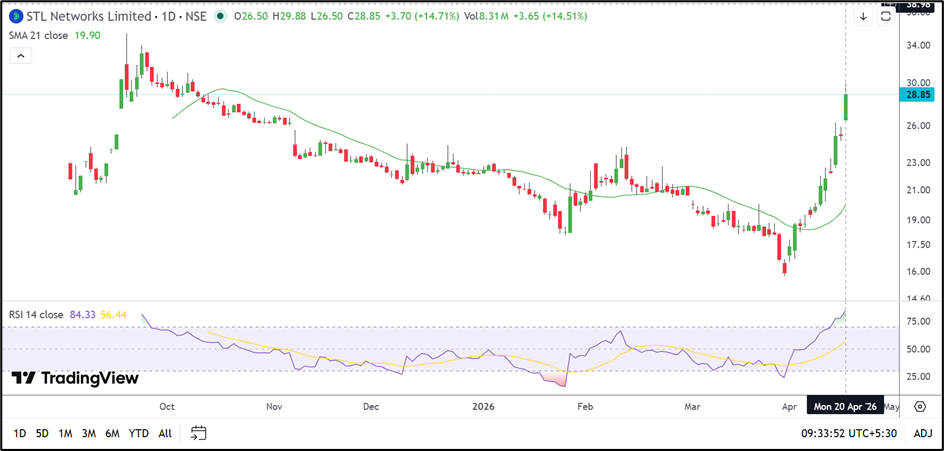
Source: TradingView
Risks to Watch
- The 14-day RSI at 84.33 suggests the stock is heavily overbought.
- STL Networks continues to report losses despite the recent rally.
- A fall below ₹27.50 may weaken the present breakout structure.
- Sharp gains in a short period can increase the risk of profit-booking.
Summary
STL Networks has delivered one of the strongest rebounds among smaller stocks this month and is now closing in on the ₹30.00 mark. While the technical picture remains positive, the very high RSI suggests that the stock may witness some cooling after its rapid rise. Traders may now watch whether STLNET can hold above ₹27.50 and continue its move toward the ₹31.00–33.50 zone.
FAQs
Why did STL Networks share price rise today?
The stock gained after extending its sharp April rebound and moving close to the ₹30.00 level.
Is STL Networks above its 21-day SMA?
Yes. STLNET is trading well above its 21-day SMA of ₹19.90.
What are the next important levels for STLNET?
Support is placed at ₹27.50–26.00, while resistance is seen near ₹31.00–33.50.