
Highlights
- T T Limited stock declined over 2% during the latest NSE trading session.
- RSI hovered near 45, indicating neutral to weak momentum in the short term.
- Price continues to trade around 50-day moving average, reflecting lack of clear trend direction.
Shares of T T Limited (NSE:TTL) is trading at ₹8.79 on March 27, 2026, falling ₹0.20 or 2.22% on the National Stock Exchange of India. The session reflected mild selling pressure with relatively moderate trading volumes compared to earlier spikes.
The stock has shown limited directional movement in recent weeks, fluctuating within a narrow price band. The latest session continues this pattern, with no strong breakout or breakdown observed.
Trend Analysis: Sideways Movement Persists
The broader trend remains weak, with the stock previously in a downtrend before transitioning into a sideways consolidation phase. The price is currently trading close to its 50-day moving average near ₹8.80, indicating indecision in market direction.
Earlier declines pushed the stock below ₹8 levels before a brief recovery in February. Since then, price action has remained largely range-bound between ₹8 and ₹10 levels.
Momentum Indicators Remain Neutral
The Relative Strength Index (RSI) stands at approximately 44.88, indicating neutral to slightly weak momentum. The RSI has been fluctuating around the mid-zone, without entering overbought or oversold territory.
This suggests that neither buyers nor sellers currently have a strong grip on the stock, reinforcing the sideways trend.
Key Technical Levels
At ₹8.79, the stock is trading within a narrow but well-defined range, with immediate support placed at ₹7.91 and stronger downside support at ₹7.47. These levels may act as demand zones where buying interest could emerge on declines. On the upside, resistance is seen at ₹9.67, followed by a higher barrier at ₹10.11, which could limit short-term rallies.
The overall technical structure suggests consolidation, and a decisive move above ₹9.67 could trigger upward momentum, while a breakdown below ₹7.91 may indicate renewed selling pressure, especially if supported by rising volumes.
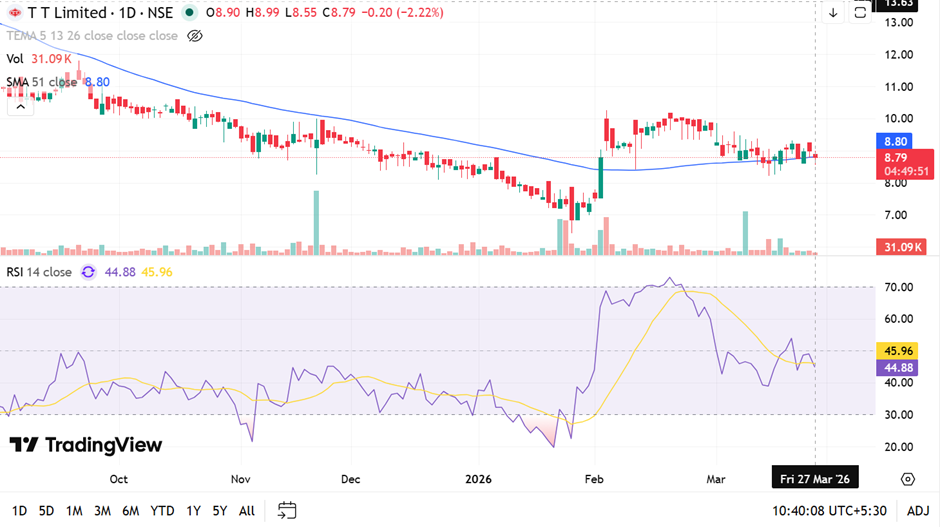
Source: TradingView
Key Risks
- Continued sideways movement may limit trading opportunities.
- Weak momentum indicators may fail to support upward moves.
- Break below ₹8 support could trigger further downside.
- Lack of volume expansion may reduce breakout chances.
Summary
T T Limited stock declined over 2% in the latest session, continuing its range-bound movement. The RSI remains near neutral levels, reflecting limited momentum in either direction. The stock trades close to its 50-day moving average, indicating indecision in trend direction. Key support and resistance levels will remain important for identifying any potential breakout or breakdown in the near term.
FAQs
- Why did T T Limited stock decline in the latest session?
The stock fell over 2% due to mild selling pressure while continuing to trade within a narrow range. - What does the RSI indicate for T T Limited stock?
RSI around 45 indicates neutral to weak momentum, suggesting no strong directional trend currently in place. - What are the key levels to watch for T T Limited stock?
Resistance levels are ₹9.67 and ₹10.11, while support levels are ₹7.91 and ₹7.47.