
Highlights
- Tamilnadu Telecommunication (NSE: TNTELE) jumped 20.00% to INR 10.62.
- The stock moved above its 50-day SMA near INR 8.85.
- December 2025 quarter net loss stood at INR 346,348.00 lakh.
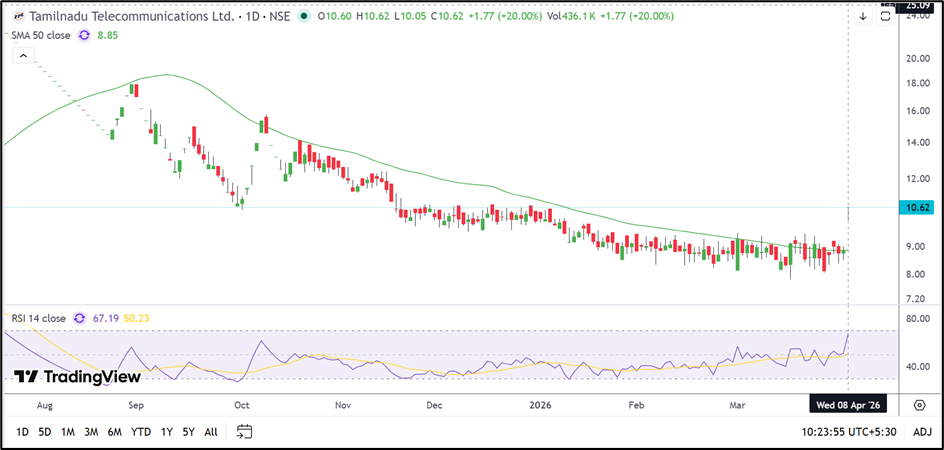
Tamilnadu Telecommunication (NSE: TNTELE) witnessed a sharp spike on 8 April 2026, with the stock hitting a 20.00% upper circuit at INR 10.62. The share opened at INR 10.60 and quickly touched its intraday high of INR 10.62. The session low remained at INR 10.05, while VWAP stood at INR 10.60.
The rally has significantly improved the short-term structure after the stock spent several months trading in a narrow and weak range. Tamilnadu Telecommunication (NSE: TNTELE) has now moved decisively above its 50-day Simple Moving Average near INR 8.85, indicating a notable shift in momentum.
Fundamental View
For the quarter ended 31 December 2025, Tamilnadu Telecommunication (NSE: TNTELE) did not report any meaningful revenue. The company posted a loss before tax of INR 346,348.00 lakh, while net loss also stood at INR 346,348.00 lakh. Earnings per share for the quarter was INR 0.76.
The latest quarterly numbers suggest that the company continues to face significant financial pressure. Despite the weak fundamentals, the current rise appears to be driven mainly by technical momentum and renewed speculative interest.
Technical View
Tamilnadu Telecommunication (NSE: TNTELE) is currently trading near INR 10.62 after breaking out sharply above the INR 9.50–10.00 band. The move has also pushed the stock comfortably above its 50-day Simple Moving Average near INR 8.85.
The latest candle reflects strong momentum after a long period of sideways trading. Unlike earlier attempts that failed near the moving average, this rally has resulted in a clean breakout and indicates that buyers have become more aggressive.
The 14-day RSI has climbed to around 67.19 and remains above its signal line near 50.23. This suggests that momentum is strengthening further, although the stock is approaching a zone where some consolidation may emerge.
As long as Tamilnadu Telecommunication (NSE: TNTELE) holds above INR 10.00, the breakout structure may remain intact. A sustained move above the recent high could open the possibility of a further rise toward the next resistance zone.
Key Technical Levels
Immediate support is placed near INR 10.00. If the stock slips below this level, the next important support is seen around INR 9.45.
On the upside, the first resistance is likely near INR 11.20. A stronger hurdle remains around INR 12.00.
Source: TradingView
Risks To Watch
- The company continues to report heavy losses.
- The stock may face profit booking near INR 11.20–12.00.
- A drop below INR 10.00 could weaken the current breakout.
- Volatility may remain high after the sharp one-day rally.
Summary
Tamilnadu Telecommunication (NSE: TNTELE) has staged a strong technical breakout after hitting a 20% upper circuit and crossing above its 50-day moving average. Momentum has improved, although the company’s fundamentals remain weak. Support is placed near INR 10.00–9.45, while resistance is seen near INR 11.20–12.00.
FAQs
- Why did Tamilnadu Telecommunication (NSE: TNTELE) rise today?
The stock surged after breaking above its 50-day moving average and crossing the INR 10.00 level. - What were Tamilnadu Telecommunication’s December 2025 results?
The company reported a net loss of INR 346,348.00 lakh for the quarter. - What are the important support and resistance levels for Tamilnadu Telecommunication (NSE: TNTELE)?
Support is placed near INR 10.00–9.45, while resistance remains near INR 11.20–12.00.