
Highlights
- Tata Chemicals Limited shares rallied 11.47% to ₹768.20 in early trade on April 13, 2026.
- The stock surged past its 50-day SMA near ₹684.10 after spending months below the indicator.
- A sharp rebound from March lows and strong quarterly profitability helped drive the breakout.
Overview
Tata Chemicals Limited (NSE: TATACHEM) climbed 11.47% to ₹768.20 on April 13, 2026, after opening at ₹689.90 and touching an intraday high of ₹773.70. The stock emerged among the strongest gainers of the session after witnessing a powerful breakout move.
The latest rise stands out because Tata Chemicals had remained trapped in a prolonged downward trend since September 2025. After several failed recovery attempts over the past six months, the stock has finally moved decisively above its 50-day Simple Moving Average and crossed a key short-term hurdle.
Fundamental View
Tata Chemicals reported solid standalone earnings for the December 2025 quarter. The company posted total income of ₹122,000.00 lakh, while profit before tax came in at ₹7,300.00 lakh.
Net profit also stood at ₹7,300.00 lakh and earnings per share was ₹2.87. The company’s strong profitability provides a fundamental cushion to the recent improvement in the share price.
Technical View
Tata Chemicals has delivered a sharp reversal from its March low near ₹600.00. Over the last few sessions, the stock moved steadily higher before exploding above ₹760.00 in today’s trade, creating one of the strongest bullish candles seen on the chart in recent months.
Unlike earlier rebounds that stalled quickly, the current move has pushed the stock well above its 50-day Simple Moving Average near ₹684.10. The stock has also reclaimed levels last seen in February 2026, suggesting that the broader structure may be shifting from a downtrend toward a recovery phase.
The 14-day RSI has jumped to 70.17, entering the overheated zone for the first time since September 2025. While this reflects very strong momentum, it also indicates that the stock may remain volatile after such a steep move.
Key Technical Levels
The ₹710.00–650.00 region may now act as an important cushion if the stock witnesses some cooling after the breakout. On the upside, if the current momentum remains intact and the stock continues to trade above the 50-day SMA, the next broader zone to watch could be ₹820.00–900.00.
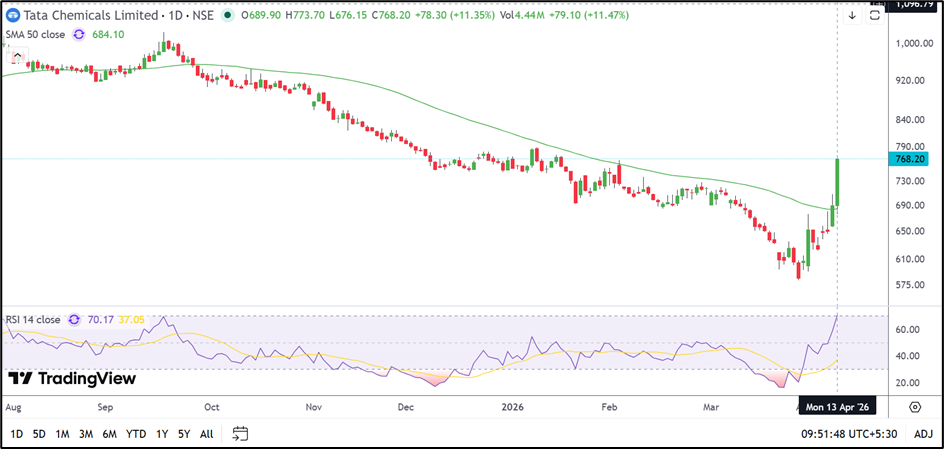
Source: TradingView
Risk to Watch
- The RSI has entered the overheated zone, which may increase near-term volatility.
- The stock has risen sharply in a short period and may witness profit booking.
- Failure to hold above the recent breakout area could weaken the recovery trend.
- Any slowdown in the chemicals sector could affect sentiment toward the stock.
Summary
Tata Chemicals appears to have broken out of its long corrective phase after reclaiming the 50-day SMA and posting a strong rally from recent lows. The move is also supported by healthy quarterly profitability. The next few sessions may decide whether the stock can sustain this breakout and extend the recovery further.
FAQs
Why did Tata Chemicals share price rise today?
The stock gained after breaking above its recent trading range and 50-day SMA, supported by stronger momentum and healthy quarterly results.
What is the 50-day SMA for Tata Chemicals?
The 50-day Simple Moving Average for Tata Chemicals is currently near ₹684.10.
How much net profit did Tata Chemicals report in December 2025?
Tata Chemicals reported a standalone net profit of ₹7,300.00 lakh in the December 2025 quarter.