
Highlights
- The stock remains below its 50-day moving average, indicating broader weakness.
- RSI has recovered toward neutral levels, suggesting improving short-term momentum.
- Deal wins and revenue figures reflect ongoing business activity during the quarter.
Tech Mahindra Limited (NSE:TECHM) traded near ₹ 1,410.50 on March 25, 2026, declining around 1.55% during the session. The stock continues to remain below its 50-day Simple Moving Average near ₹ 1,516.44, indicating a weaker broader technical structure.
The price action reflects a sharp decline in earlier sessions followed by a rebound from lower levels. This recent movement suggests a phase of stabilisation rather than a confirmed reversal. The stock appears to be attempting to form a base, with price holding above immediate support zones.
Momentum Indicators Show Gradual Recovery
The 14-day Relative Strength Index (RSI) is positioned near 49.90, indicating a move toward the neutral zone. This shift suggests that selling pressure has moderated and buying interest is gradually returning.
A neutral RSI typically reflects balanced momentum, where neither buyers nor sellers dominate. This condition often aligns with consolidation phases, where the next directional move depends on broader market cues.
Key Support and Resistance Levels
Tech Mahindra Limited is currently trading near ₹1,410.50 as of March 25, 2026, declining around 1.55%, and remains below its 50-day Simple Moving Average near ₹1,516.44, indicating a weak broader setup. The price action shows a sharp decline followed by a rebound from lower levels, with the recent move suggesting a stabilisation phase.
The 14-day RSI near 49.90 reflects recovery towards the neutral zone, indicating improving momentum. In the near term, support is placed around ₹1,300.00–₹1,250.00, while resistance is seen near ₹1,500.00–₹1,620.00.
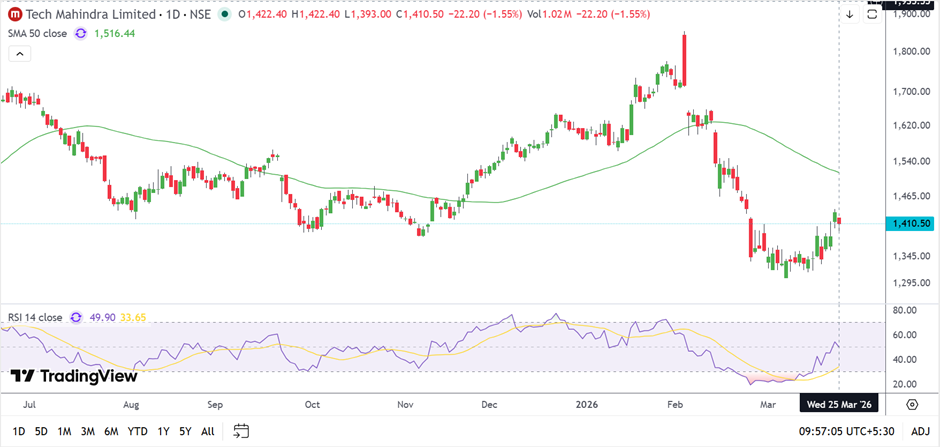
Source: TradingView
Q3 FY26 Financial Snapshot
For Q3 FY26, Tech Mahindra reported revenue of USD 1,610 million. EBIT margin stood at 13.1%, while operational PAT margin was reported at 9.2%.
Free cash flow for the quarter was recorded at USD 194 million. The company also reported new deal wins worth USD 1,096 million, indicating ongoing deal activity during the period.
Key Risks
- Sustained trading below key moving averages may indicate continued technical weakness.
- Resistance zone near ₹ 1,620 may limit upside in the near term.
- Fluctuations in deal wins could impact revenue visibility across quarters.
- Margin variability may influence profitability trends and investor sentiment.
Summary
Tech Mahindra stock remains below its 50-day moving average, reflecting a weaker broader trend despite recent stabilisation. Momentum indicators show recovery toward neutral levels, suggesting easing selling pressure. Key support and resistance zones indicate a consolidation range. Financial metrics highlight steady deal activity and margins, while technical levels remain critical for determining the next directional move in the stock.
FAQs
- What is the current technical trend of Tech Mahindra stock?
The stock shows a weak broader trend as it trades below its 50-day moving average. - What do current RSI levels indicate?
RSI near 50 reflects neutral momentum, indicating a balance between buying and selling pressures. - What are key support and resistance levels?
Support is between ₹ 1,300–1,250, while resistance lies in the ₹ 1,500–1,620 range.