
Highlights
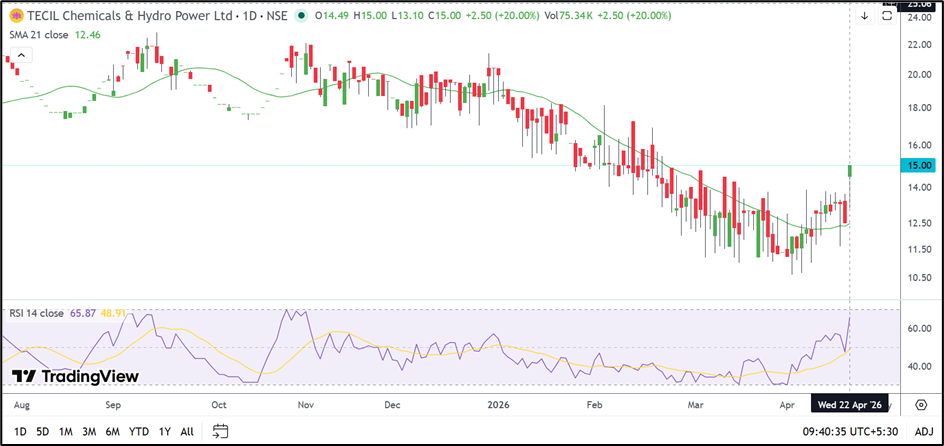
- TECIL Chemicals and Hydro Power Ltd (NSE: TECILCHEM) surged 20.00% to ₹15.00 and locked in the upper circuit.
- The stock moved above its 21-day SMA of ₹12.46, indicating a sharp improvement in short-term momentum.
- TECIL Chemicals and Hydro Power remained loss-making in the December 2025 quarter.
Overview
TECIL Chemicals and Hydro Power Ltd (NSE: TECILCHEM) jumped 20.00% to ₹15.00 after opening at ₹14.49 and touching an intraday high of ₹15.00. The stock remained locked at the upper circuit through the session.
The rally comes after a prolonged period of weakness during which the stock had slipped close to the ₹10.50–11.00 region. The latest move has lifted TECIL Chemicals and Hydro Power to its highest level in more than two months.
Fundamental View
For the quarter ended December 2025, TECIL Chemicals and Hydro Power did not report any material income.
The company posted a loss before tax of ₹7.25 lakh, while net loss also stood at ₹7.25 lakh. Earnings per share remained negative at ₹-0.04.
The company has remained loss-making for several quarters, which means the recent rally is currently being driven more by technical factors than by any visible improvement in fundamentals.
Technical View
TECIL Chemicals and Hydro Power is now trading above its 21-day Simple Moving Average of ₹12.46 for the first time in several weeks. This suggests that the recent downward trend has started to weaken.
The stock had spent most of the past month consolidating between ₹11.00 and ₹13.00. The sudden move above this range has changed the short-term structure and may attract further speculative interest.
The 14-day RSI has climbed to 65.87, indicating that momentum has strengthened sharply but is not yet in extreme territory. If the stock continues to hold above the recent breakout zone, the recovery may extend further.
Key Technical Levels
The ₹14.00–12.90 region may now act as the first support zone if the stock sees some cooling after the upper-circuit move. Holding above this band would keep the recent breakout intact.
On the upside, the next hurdle may emerge around ₹16.20–17.25. A move above ₹16.20 could allow TECIL Chemicals and Hydro Power to extend the current rally.
Source: TradingView
Risks to Watch
- The company remains loss-making, which may limit the sustainability of the recent rally.
- Stocks locked in upper circuits can witness equally sharp reversals if momentum weakens.
- Failure to hold above ₹14.00 may weaken the recent breakout structure.
- The stock remains highly speculative and may continue to show sharp volatility.
Summary
TECIL Chemicals and Hydro Power Ltd (NSE: TECILCHEM) has staged a sharp rebound after remaining under pressure for several months. The move above the 21-day SMA and the breakout from the recent range have improved the technical picture.
However, the company’s weak earnings profile remains a concern. The next few sessions may determine whether the stock can sustain above ₹14.00 and extend the move toward ₹16.20–17.25.
FAQs
Why did TECIL Chemicals and Hydro Power share price rise today?
The stock rallied sharply after breaking above its recent trading range and moving above the 21-day SMA.
Is TECIL Chemicals and Hydro Power trading above its 21-day SMA?
Yes. The stock is now trading above its 21-day SMA of ₹12.46.
What are the next key levels for TECIL Chemicals and Hydro Power?
The stock may find support near ₹14.00–12.90, while the next upside zone is around ₹16.20–17.25.