

Highlights
- Thomas Scott shares surged 19.99% and hit the upper circuit on May 27.
- Stock moved above its 21-day moving average after recent consolidation.
- RSI climbed above the neutral zone, reflecting improving momentum conditions.
Overview
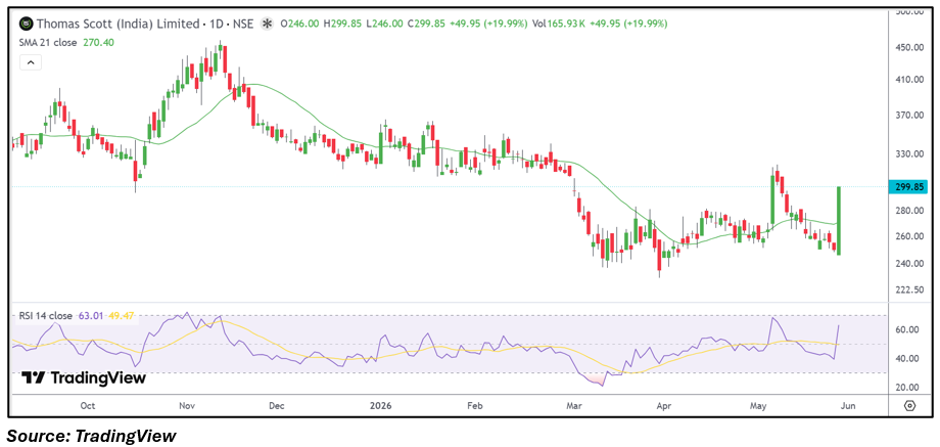
Thomas Scott (India) Limited (NSE: THOMASCOTT) witnessed a sharp rally on May 27, with the stock locking in a 20% upper circuit during the session. The counter traded near INR 299.85 after opening at INR 246.00 and touching the day’s high at INR 299.85.
The sharp move came after a prolonged consolidation phase seen over recent weeks. Traders tracked the stock closely as momentum improved alongside higher price action near short-term breakout levels.
Fundamental View
For the quarter ended December 2025, the company reported standalone total income of INR 6,646.49 lakh. Profit before tax stood at INR 636.83 lakh, while net profit came in at INR 496.78 lakh. Earnings per share for the quarter was reported at INR 3.39.
Market participants are monitoring whether the recent momentum in the stock can sustain amid broader volatility in small-cap counters.
Technical View
Thomas Scott stock closed near INR 299.85 while moving above its 21-day moving average near INR 270.40, reflecting improving near-term structure. Recent price action indicates a sharp rebound after the recent consolidation phase, with the stock witnessing strong upward momentum during the session. The 14-day RSI moved near 63.01, rising above the neutral zone and indicating improving momentum conditions. Immediate support is placed in the INR 270.00–255.00 zone, while resistance is seen around INR 330.00–350.00 levels.
Key Technical Levels
Immediate support for the stock is placed near INR 270.00, followed by a broader support zone around INR 255.00. On the upside, resistance is visible near INR 330.00 and INR 350.00, where volatility may increase.
Risks to Watch
- Sharp rallies may trigger short-term profit booking pressure.
- Failure to hold INR 270.00 could weaken momentum.
- Small-cap volatility may lead to wider price swings.
- Weak broader market sentiment may affect recovery attempts.
Summary
Thomas Scott shares witnessed a sharp upward move and hit the upper circuit after recent consolidation near lower levels. The stock moved above its short-term moving average while RSI also improved, indicating strengthening momentum conditions. Traders are likely to monitor support near INR 270.00–255.00 and resistance around INR 330.00–350.00 for further price direction.
FAQs
Why did Thomas Scott shares rally today?
The stock surged sharply after witnessing consolidation, with momentum improving during the session.
What were Thomas Scott’s latest earnings?
The company reported net profit of INR 496.78 lakh and EPS of INR 3.39 for December 2025.
What are the key levels for THOMASCOTT stock?
Key support is placed near INR 270.00–255.00, while resistance is visible around INR 330.00–350.00.