
Highlights
- JHS Svendgaard Retail Ventures shares jumped over 10% and entered the top gainers list.
- The stock rebounded sharply despite reporting a quarterly net loss.
- Price action moved closer to the 50-day SMA amid improving short-term momentum.
Overview
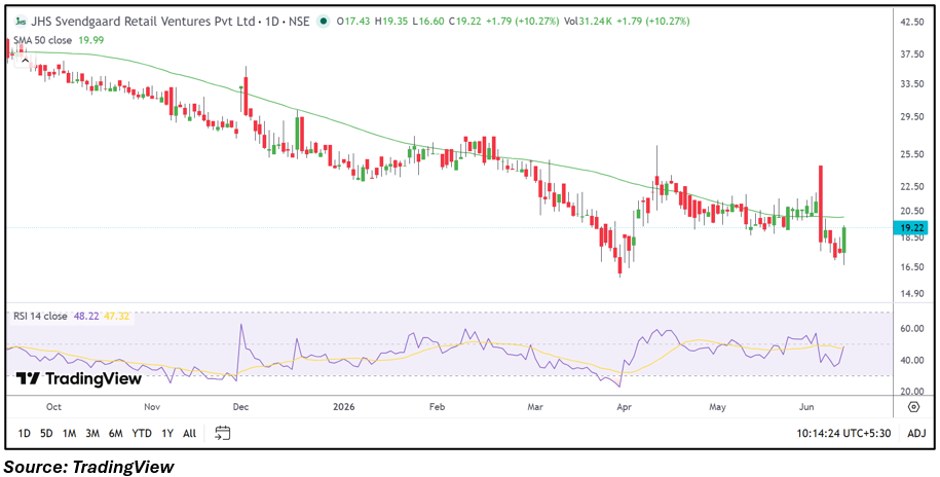
JHS Svendgaard Retail Ventures (NSE: RETAIL) attracted market attention after climbing more than 10% to around ₹19.21 during Thursday's session. The stock touched an intraday high of ₹19.35 and emerged among the day's top gainers despite the absence of any major corporate announcement.
The move comes after a period of weakness in the share price, suggesting traders are closely tracking the stock's recovery attempt near important technical levels.
Fundamental View
For the quarter ended March 2026, the company reported consolidated total income of INR 599.52 lakh. However, it posted a loss before tax of INR 37.28 lakh and a net loss of INR 21.45 lakh, resulting in earnings per share of negative INR 0.13.
While the recent rally has improved market sentiment toward the stock, investors may continue to monitor whether the company can return to sustainable profitability and improve its financial performance in upcoming quarters.
Technical View
JHS Svendgaard Retail Ventures is trading near ₹19.21 while approaching its 50-day SMA of ₹19.99. The stock has rebounded from recent lows and recovered a significant portion of its short-term decline. RSI stands at 48.22, indicating momentum has improved from oversold levels but remains below the bullish 50 threshold. A sustained move above the 50-day SMA could improve the near-term technical outlook.
Momentum Indicator
The 14-day RSI is at 48.22, showing recovery in momentum after recent weakness. The indicator remains near the neutral zone, suggesting traders may look for additional confirmation before expecting a broader trend change.
Key Technical Levels
JHS Svendgaard Retail Ventures is currently trading around ₹19.21 and is approaching its 50-day SMA near ₹19.99. Immediate support is seen in the ₹17.50–₹16.60 zone, which has recently attracted buying interest. On the upside, a decisive move above the ₹20.00 level and the 50-day SMA could shift attention toward the ₹22.50–₹24.00 region.
Key Risks to Watch
- Company reported a net loss in the latest quarter.
- Low trading participation may increase volatility.
- Earnings recovery remains uncertain.
- Sharp price swings can impact short-term sentiment.
Summary
JHS Svendgaard Retail Ventures entered the top gainers list after a double-digit rally despite continuing to report losses. The stock is attempting to recover toward its 50-day SMA, while momentum indicators show gradual improvement. Investors are likely to watch whether the company can improve profitability and whether the stock can maintain its recent rebound above key technical levels.
FAQs
- Why did JHS Svendgaard Retail Ventures shares rise today?
The stock witnessed a sharp rebound and attracted trading interest despite no major corporate announcement. - Is the company currently profitable?
No, the company reported a consolidated net loss of INR 21.45 lakh in the March 2026 quarter. - What technical level are investors watching?
Market participants are closely monitoring the 50-day SMA near ₹19.99 and the stock's ability to sustain above recent support levels.