
22 April 2026
Highlights
- Transformers & Rectifiers (India) shares dropped 8.39% to ₹305.35 after the company reported weaker March 2026 quarter profitability.
- Consolidated March-quarter revenue stood at ₹78,267 lakh, while net profit came in at ₹8,928 lakh.
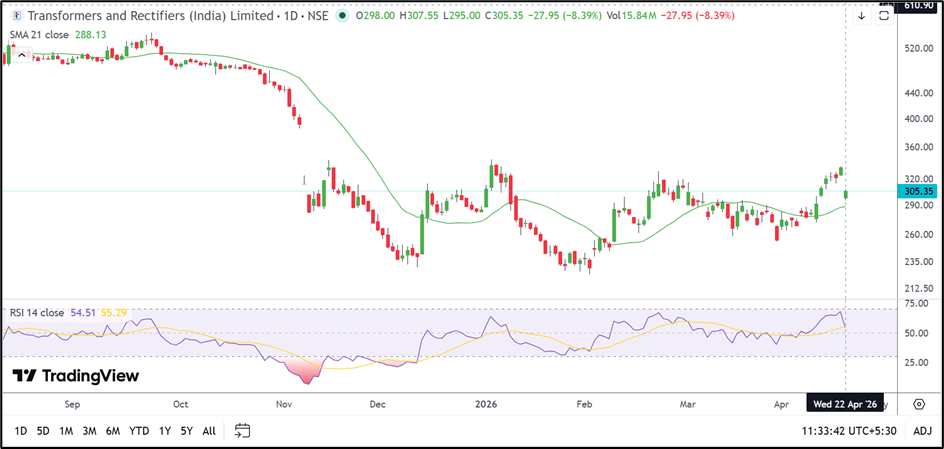
- The stock remains above its 21-day SMA near ₹288.13, but it is facing resistance below the ₹330 zone.
Overview
Transformers & Rectifiers (India) (NSE: TARIL) declined sharply on April 22 after investors reacted negatively to its March 2026 quarter earnings. The company reported higher revenue, but lower profitability and softer margins weighed on sentiment after the stock had rallied strongly in recent weeks.
The stock opened at ₹298.00 and touched an intraday high of ₹307.55 before slipping to ₹305.35, down 8.39% from the previous close of ₹333.30.
Fundamental View
Transformers & Rectifiers reported consolidated total income of ₹78,267 lakh for the March 2026 quarter, compared with ₹74,102 lakh in the December 2025 quarter. However, net profit softened to ₹8,928 lakh in Q4 FY26 versus ₹7,597 lakh in the previous quarter, while margins narrowed because of higher costs and execution pressure.
For the December 2025 quarter, the company had reported consolidated total income of ₹74,102 lakh, profit before tax of ₹10,779 lakh, and net profit of ₹7,597 lakh.
Despite the latest pressure on margins, the company continues to benefit from strong demand in the power and transmission equipment segment. A healthy order pipeline and expansion in transformer capacity could support revenue growth over the coming quarters.
Technical View
The stock is trading near ₹305.35 and continues to remain above its 21-day SMA near ₹288.13, indicating that the broader short-term structure is still constructive despite today’s decline.
However, the stock failed to sustain above the recent swing zone near ₹330 and has slipped back below that band. This suggests that the recent rebound may be losing momentum and that prices could enter a consolidation phase over the next few sessions.
If the stock remains above the ₹270–250 support area, the broader rebound structure may stay intact. On the upside, the stock is currently facing resistance below ₹330, and a move above this zone could open the way toward the ₹365 band.
Momentum Indicator
The 14-day RSI stands near 54.51, down from recent higher readings. This suggests that momentum has moderated after the recent up move. Although the RSI remains above the neutral 50 mark, the indicator no longer reflects the same pace of recovery seen earlier in April.
Source: TradingView
Key Technical Levels
- Support: ₹270–250
- Resistance: ₹330–365
Key Risks
- Margins may remain under pressure if input costs stay elevated.
- Failure to hold above ₹270 could weaken the near-term structure.
- The stock is facing resistance below ₹330, which may keep upside limited in the short term.
- Any slowdown in fresh order inflows could affect future growth expectations.
Summary
Transformers & Rectifiers remains supported by healthy industry demand and a strong execution pipeline, but the March-quarter results indicate that profitability is not improving as quickly as revenue. The stock continues to trade above its 21-day SMA, though resistance near ₹330 remains a hurdle. Unless the stock reclaims that band, the recent rebound may pause and shift into a sideways range.
FAQs
Why did Transformers & Rectifiers shares fall today?
The stock declined after the company reported weaker March-quarter profitability and softer margins, despite posting higher revenue.
What are the important technical levels for TARIL?
Support is placed at ₹270–250, while resistance is seen near ₹330–365.
Is the broader trend still positive?
The broader structure remains constructive as long as the stock holds above the ₹270–250 support area and stays above its 21-day SMA.