
Highlights
- Trent stock gained 14.10% in one week, outperforming NIFTY 50 index.
- One-month return of 24.22% remained higher than benchmark performance.
- Long-term returns stayed elevated despite decline seen over the past one year.
Shares of Trent Limited (NSE:TRENT) showed active movement in the latest trading session. The stock opened at ₹4,264.00 and touched a high of ₹4,444.50, while the low remained at ₹4,242.80, close to its previous closing price of ₹4,242.80.
The VWAP stood at ₹4,363.42, indicating that most trades were executed around this level. The price movement shows a narrow range at the lower end and some upward momentum during the session.
Returns Compared to Benchmark
The stock has performed better than the NIFTY 50 in recent periods. Over the past week, Trent delivered a return of 14.10%, compared to 2.96% for the index.
In the last one month, the stock gained 24.22%, while the index rose 6.20%. On a year-to-date basis, the stock increased 2.90%, whereas the index declined 6.12%.
However, over the past one year, the stock declined 17.50%, while the index showed a gain of 1.75%.
Long-Term Performance
Despite recent decline, Trent has delivered high returns over the long term. The stock rose 219.65% over three years and 500.39% over five years. These returns are much higher than the benchmark index over the same period.
Trading Activity and Liquidity
Trading activity remained strong, with total traded volume at 16.52 lakh shares and traded value at ₹720.93 crore. The stock’s impact cost stood at 0.02, showing good liquidity in the market.
The company’s total market capitalisation stood at ₹1,56,144.31 crore, with a free float market cap of ₹97,296.41 crore. Deliverable quantity was 37.22% of traded volume, indicating a mix of short-term and long-term participation.
Price Range and Volatility
The stock is currently trading below its 52-week high of ₹6,261.00 and above its 52-week low of ₹3,275.50. Daily volatility was recorded at 2.32%, while annualised volatility stood at 44.32%, showing noticeable price fluctuations.
Financial Snapshot
For the quarter ended December 31, 2025, the company reported consolidated total income of ₹5,36,385 lakh. Profit before tax stood at ₹66,407 lakh, while net profit was ₹51,011 lakh. Earnings per share was ₹14.42.
On a standalone basis, total income stood at ₹5,41,279 lakh, with net profit of ₹63,971 lakh and earnings per share of ₹18.00.
Key Risks
- High volatility may lead to sudden price changes in short term.
- Retail sector demand changes may impact revenue growth.
- Market corrections can affect stock performance.
- Dependence on consumer spending trends may influence earnings.
Technical Summary
Trent Limited (NSE:TRENT) is trading near ₹4,424.20, up around 4.28% as on 21 April 2026, and continues to remain above the 51-day SMA near ₹3,856.93, while the 14-day RSI near 73.58 points. Immediate support is placed in the ₹4,000.00–3,850.00 zone, while resistance is seen near the ₹4,500.00–4,750.00 range.
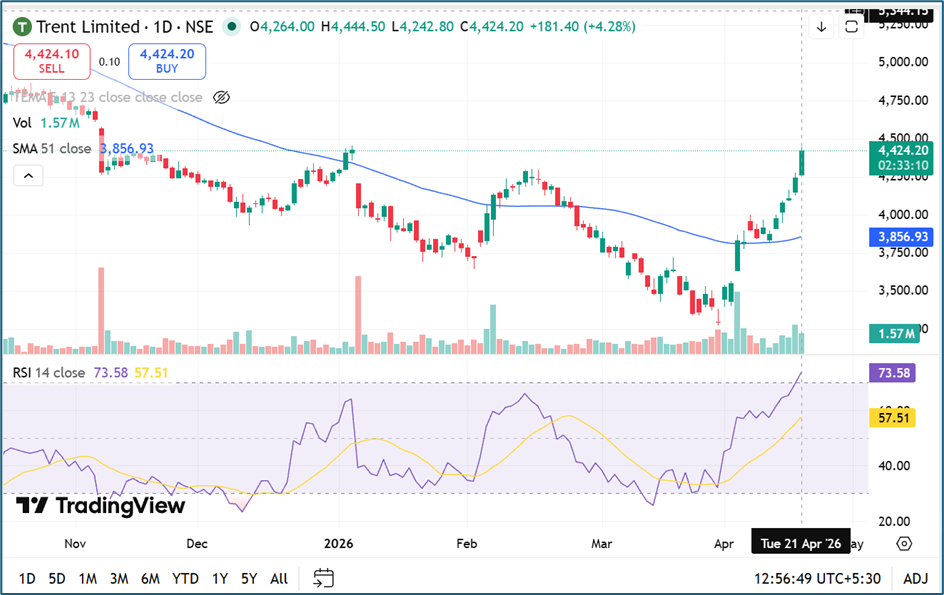
Source: TradingView
Summary
Trent stock has shown strong gains in the short term and continues to outperform the benchmark index in recent periods. However, one-year returns remain negative, reflecting recent pressure. Long-term performance remains high with significant multi-year gains. Trading activity indicates balanced participation, while volatility suggests continued price movement.
FAQs
- How did Trent stock perform recently?
The stock gained 14.10% in one week and 24.22% in one month, outperforming the broader market index. - What are Trent’s long-term returns?
The stock delivered 219.65% returns over three years and 500.39% over five years, higher than benchmark returns. - What are the key risks for Trent stock?
Key risks include volatility, retail demand changes, market corrections, and dependence on consumer spending trends.